Structured Logging in Azure with Structlog

Greg Soertsz
Principal Engineer
Greg Soertsz
Principal Engineer
How Structlog and Azure maximises the analytic value in logs
Logging remains an essential pillar in the observability of our systems, and centralised log aggregation tools have industrialised log analytics at scale. However, modern logging architectures remain plagued with challenges that limit their long-term effectiveness and introduce cost and application maintainability issues. Driven by scale, logging in modern applications has become almost paradoxically perilous. We need logs, but we hate logging!
In this blog, I review some of these challenges and demonstrate how logs can be generated with software maintainability in mind. Additionally, via a mindset shift, and some consistency, I address how we can maximise the return on investment in centralised log aggregation in the Azure data ecosystem.
Almost there with Structured Logging
While structured logging, along with a plethora of log aggregation tools, has helped DevOps teams deal with the scale and heterogeneity of logs with a “single pane of glass”, some fundamental complaints still exist around logging architectures.
Logging is easy
It’s uncontroversial to assume developers just get it when it comes to logging. We’ve been inserting print() messages since forever, and logging code is added arbitrarily throughout the code as needed. Log levels are key to managing the granularity of log messages being emitted, and if there is certainty in the environments that populate the path to production, and we have a well-written and relevant logging standard, the how and what of logging is a solved problem. Logging libraries are prolific, exist for most languages, and all present a common implementation architecture and API.
But, logging is unnatural and complicated
Logging places a downward pressure on software quality.
In order to log meaningful messages (even if they aren’t pretty), throughout the code, developers need to construct distinct and descriptive event strings, rich with context and often composed of variables evaluated at the last minute. There isn’t a general intuition about how to design a component for logging, and for the most part, logging APIs are globally configured and referenced accordingly. Context smear, and log littering, and embarrassingly, runtime log message failures, all comprise a potent, emergent characteristic of introducing logging to a meaningful production app.
From a testing perspective, logging is not bound by any formality or contract, and while tests will exercise logging statements logically, it’s a code smell to assert and verify the output of logs in tests. You wouldn’t typically mock a logging API, so logging escapes the typical strategies we employ to manage software quality.
Logging from within a running app (for diagnostic purposes or otherwise) also creates a raft of implications, particularly when considering the privacy and sensitivity of some of this information. We may log the full interaction with a remote service call, and you’ve potentially sent API keys, PII, and PCI data in clear text to the log aggregation tool. This can be dealt with at the source with logging filters and plug-ins, and log aggregation tools have scanning options. Mileage varies, however, and design consideration must be paid to where to apply, how to configure, and how to fine-tune these controls across the system.
And log messages vary wildly
From the point of view of the log aggregation tool, logs vary wildly. Logs are emitted at varying levels, with different structures and details that also change over time as software evolves. These will also vary across teams, each at various levels of maturity.
When aggregated, we might look to logs to reconstruct a processing trace across systems, but that would require consistency in correlation identifiers, which is not guaranteed.
This variety and lack of consistency at scale make it difficult to yield analytic value from logs, not to mention the high coupling and query sprawl between the source systems and the log aggregation tool.
Also, logging is expensive
Monetary costs are a huge concern when dealing with 3rd party log aggregation tools:
- Vendors will charge for ingestion, storage and retrieval, in addition to monthly subscription fees.
- Vendors are required to maintain a certain SLA for their customers — quite rightly — so they also need to throttle your ingestion to protect other customers.
- Logs retained but unused are perceived as waste and are righteously and easily dispensed with.
- Cost sharing and chargeback — only within platforms where this is baked in initially, and supported by the tool.
The data warehouse’s poor cousin
Time-honoured and widely popular edicts tell us that logs are just data. If we take that to an extreme and into the modern data warehousing world, log aggregation tools are derivative data warehouses.
Over time, data warehouses suffer entropy if they don’t have strong hygiene provisions. Analytic artefacts, such as queries, notebooks and visualisations, alert configurations and dashboards, predominantly created via click-ops, proliferate wildly within the tool, until eventually they end up resembling one’s kitchen pantry.
When it comes to performing log analytics, the tool should facilitate rapid, governed access and sustainable short time to insight, but log aggregation tools, in general, would benefit from broader governance, modelling and management practices that already exist in modern data warehousing. Indeed, modern data warehouses and practices are geared to maximising the analytic value of data. Would logging be so expensive if logs were much more valuable?
Taking this further, it follows that these same practices would be useful in log analytics. I’ll leave as an exercise for the reader, consideration as to the degree of convergence we’ll see between modern data warehouses and log analytics tools specifically.
So, what do we want?
Not unreasonably, we can express a desired state, as generally:
A good logging architecture, regardless of scale, is one that seeks to maximise the sustained analytic and diagnostic value in logs, while minimising the impact to software quality, and performance.
We focus on the analytic and diagnostic value in logs in the above statement to offset the costs associated with centralised aggregated logging, which we still need. Maximising this value allows logs to be involved in the virtuous growth cycle associated with using data generated from users to improve products.
We also don’t overly favour the analytic value to the detriment of software maintainability and performance, two key metrics in providing great products.
This balance is at the heart of our ideal target state.
Structured Logging in Azure
To demonstrate some of these considerations, let’s examine an Azure Function App written in Python, that uses Structlog to do some logging, along with an Azure Log Analytics Workspace to explore the analytic value we can extract from logs.
Structlog — a good logging API
Structlog is a structured logging library for Python projects.
It has a run-of-the-mill logging API (log(…), debug(..), etc.) and handler/formatter framework typical of most industrial strength logging implementations. No different from other logging APIs, log levels are the typical way in which we manage app performance tradeoffs with logging.
With logs being emitted from multiple and various scopes within the application, context is key, and Structlog also provides good support for managing context information, such as bind_contextvars(..) which allows dictionary-like structures to be provided and bound to the logging context as key-value pairs. These methods can be used to store key-value context variables and can prevent the need to propagate that detail throughout the code.
Let’s explore how we might use this capability to deal with context, while also looking to improve logging consistency and the quality of log data.
Standardisation of logs with a Python logging decorator
How might we achieve greater consistency in the log messages we generate throughout the code and across apps?
By way of example, we can leverage Structlog’s context management functions, its general log message API, and Python decorators to consistently log the entry to and exit from different functions within the implementation.
Leveraging decorators, allows us to simply mark functions that we are interested in. Once marked with the logging decorator, we can emit “Entering”, and “Exiting” events prior to, and after execution respectively, as well as adding function details (name, args, etc) to the context information around logs. Additionally:
- If we do any direct logging within the marked function, we want those logs to come through with the same context information.
- Once we exit the function, we want the additional context (for the nested scope) to be removed and the prior context to be restored for the outer scope (if applicable)
- We want the logger used in the decorator to be customisable with respect to level to avoid surprises and to control the overall log level as usual.
Below is the definition of the decorator that does all of this:
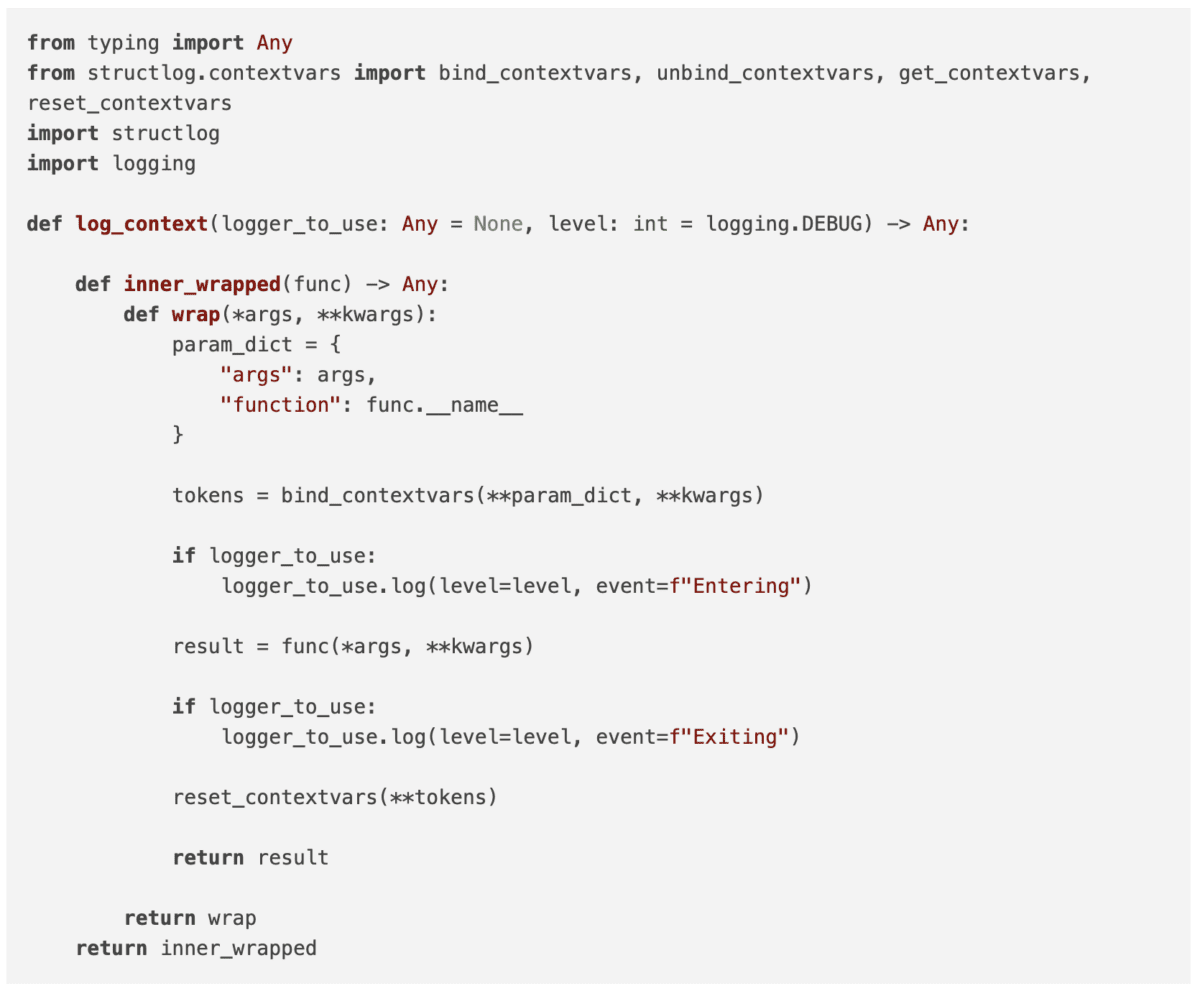
This decorator can be used as follows:

For the above functions, let’s examine the log messages received:
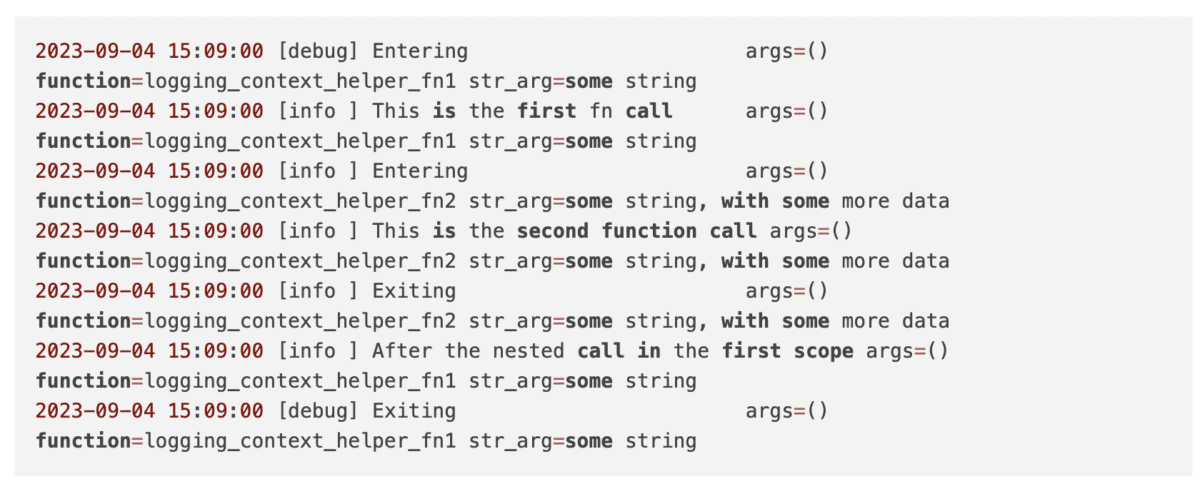
In the above scenario, entry/exit logging for logging_context_helper_fn1 was done at the DEBUG level (default), whereas for logging_context_helper_fn2, entry/exit logging was done at INFO level, (as per the decorator parameter). Additionally, the arguments that were provided to the function at various levels are being logged accurately with respect to the correct contextual scope. Nice!
So, in principle:
The decorator approach helps us achieve consistency in log messages, and provides us a low-effort, and unintrusive way to log entry and exit to a function, without loss of customisability and flexibility afforded through the logging API. It also enhances the reliability and contextual richness of ad-hoc direct logging done within the decorated function, by inheriting and managing context correctly, and preventing the need to explicitly pass context into the function or compute it at event message construction time.
The Python Function App
Let’s see this logging approach with Structlog and decorators in action in a Python Function App integrated with Azure Log Analytics. All of the following code is available on Github.
The function app uses the Open Weather API. Function Apps are a good example of at-scale cloud logs — we would very rarely log into the ‘host’ of a Function App (although in Azure, this is possible).
The Open Weather API is a rich API service that provides current weather information given a geocoded location (lat, long). Obviously, this is a little inconvenient, as a plain English location (city, state, country, etc.) needs to be geocoded into coordinates before we can derive weather information. Conveniently, the Open Weather API provides a geo-coding service as well. The function app accepts a request containing a city, state, and country, then:
- Uses the geocoding API to obtain the latitude (lat) and longitude (long) of the location
- Uses the weather API to retrieve the current weather for the lat/long acquired in (1)
- Returns the current weather payload to the user
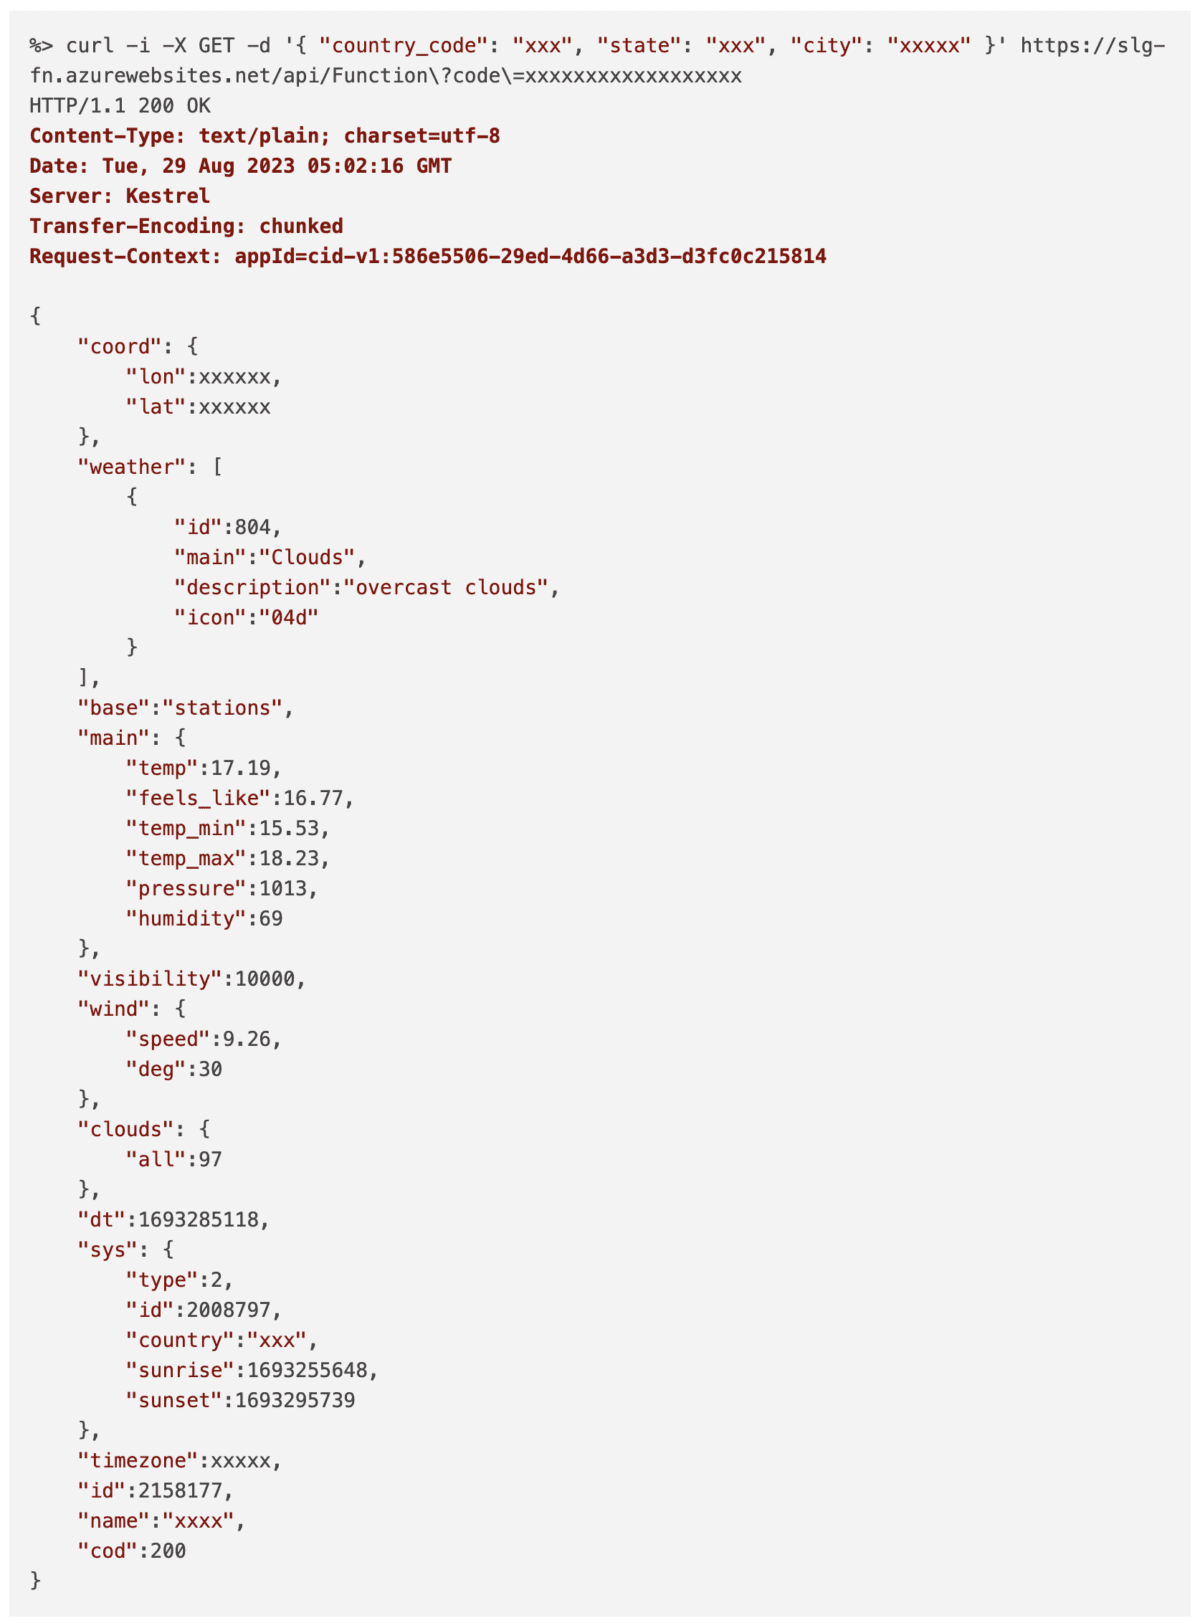
Below is an example request to the function app. The response we see below is the function app forwarding it’s response back on to the client, which in effect is the response from the Open Weather API service.
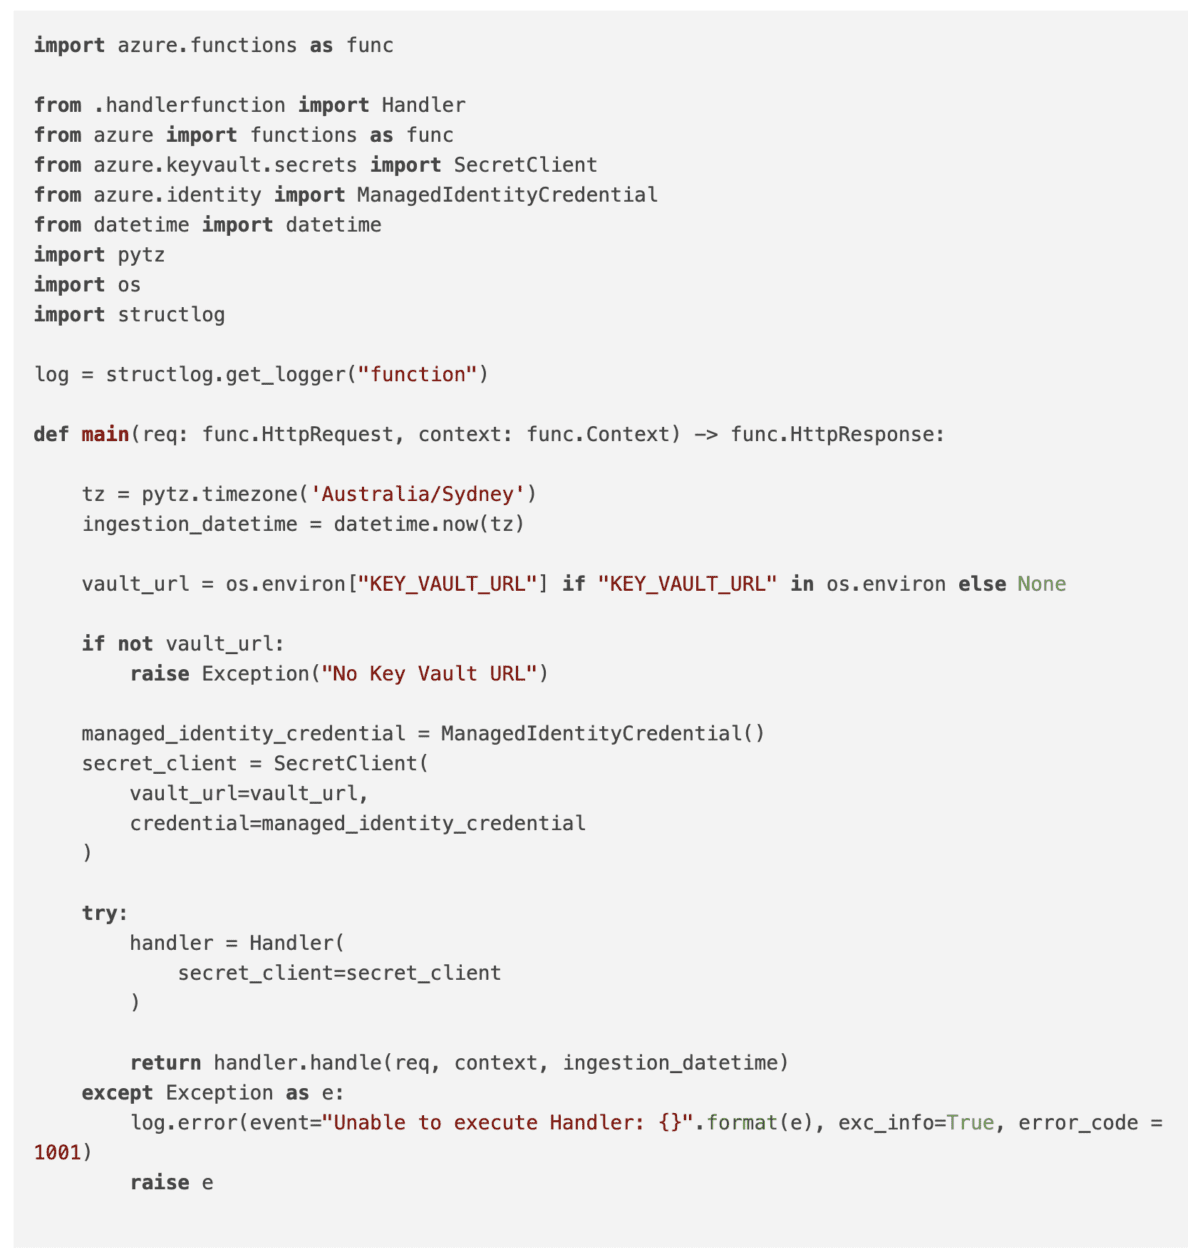
Here is the code for the main handler function of the function app:
Here is the code for the handler service of the function app:
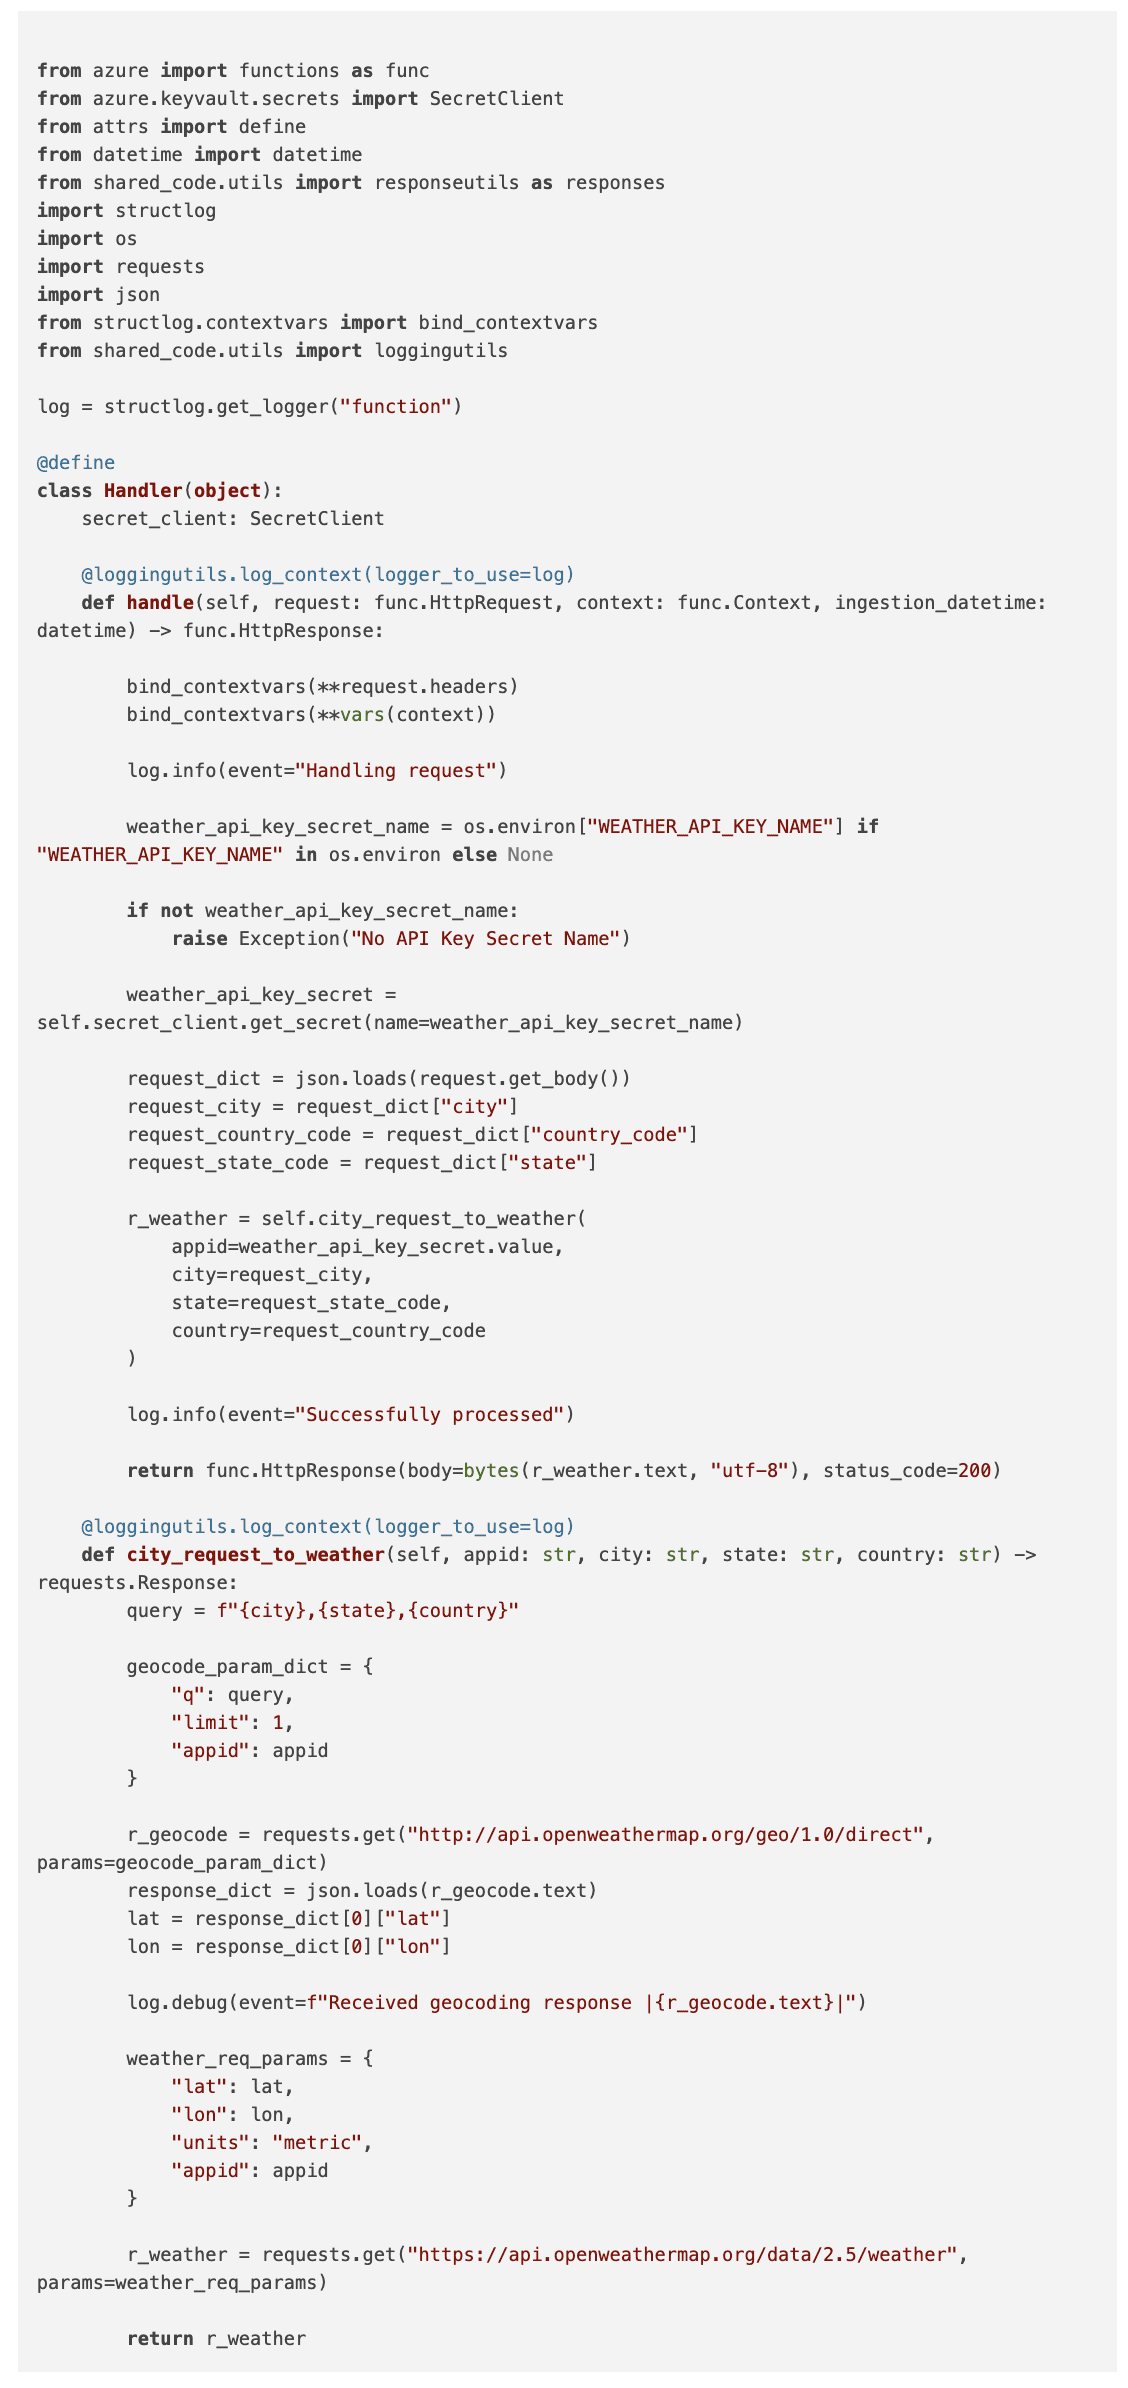
From a logging point of view the loggingutils.log_context(...) decorator is applied to the handle(...) function, and the city_request_to_weather function. For each of these, the globally configured logger is passed in, and the default log level (DEBUG) is not overridden.
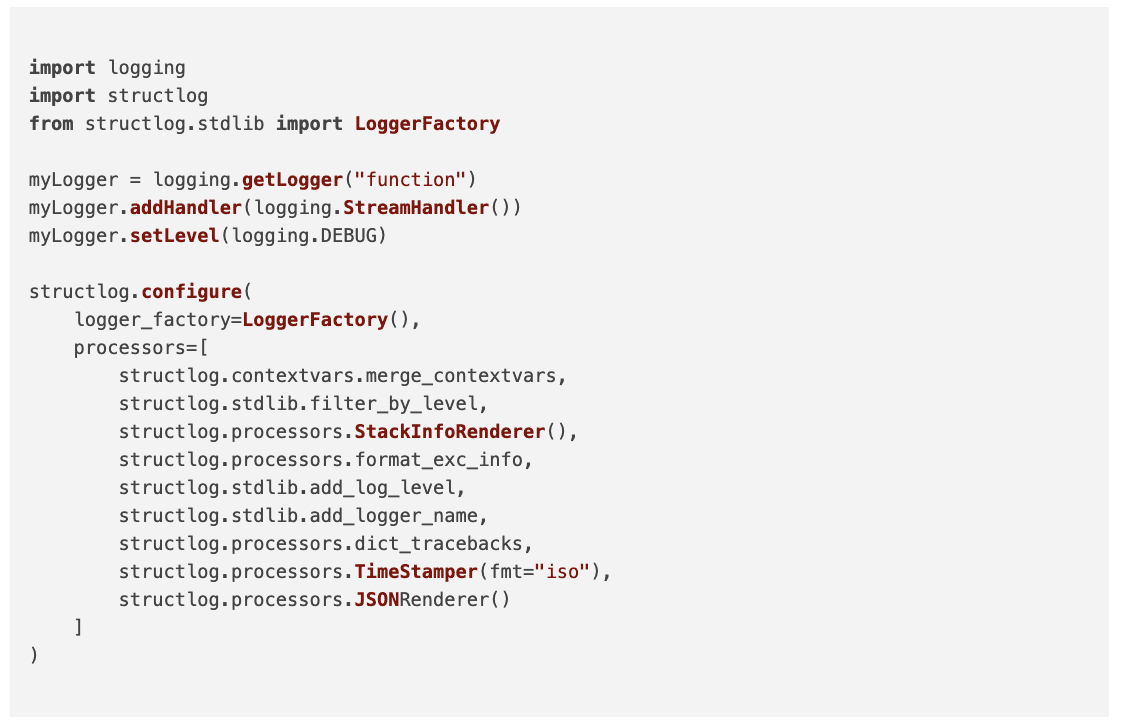
Below is the package-level __init__.py file containing the logging configuration. As __init__.py files are executed at package import time this is an appropriate place to initialise the once off logging configuration for the entire app. Conveniently, this configuration is used by the decorated function logging as well as any ad-hoc direct logging as appropriate.
Once deployed and the app is servicing requests, let’s execute the following query to confirm that diagnostic logs are being sent to a Log Analytics Workspace and that we can see some logs.
Azure Log Analytics
With the function app configured to send all logs to a Log Analytics Workspace, we are able to query the logs:
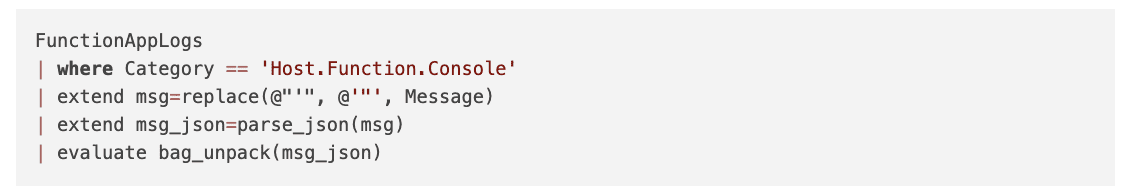
It should be noted that even though JSON messages produced by Structlog are well-formatted JSON, they arrive at Log Analytics with single quotes (') rather than double quotes ("). We execute a text replace function within Kusto to convert the Message column to valid JSON.
We then parse the well-formatted JSON string into a dynamic object; then we can use the bag_unpack operation to convert all the JSON keys into columns.
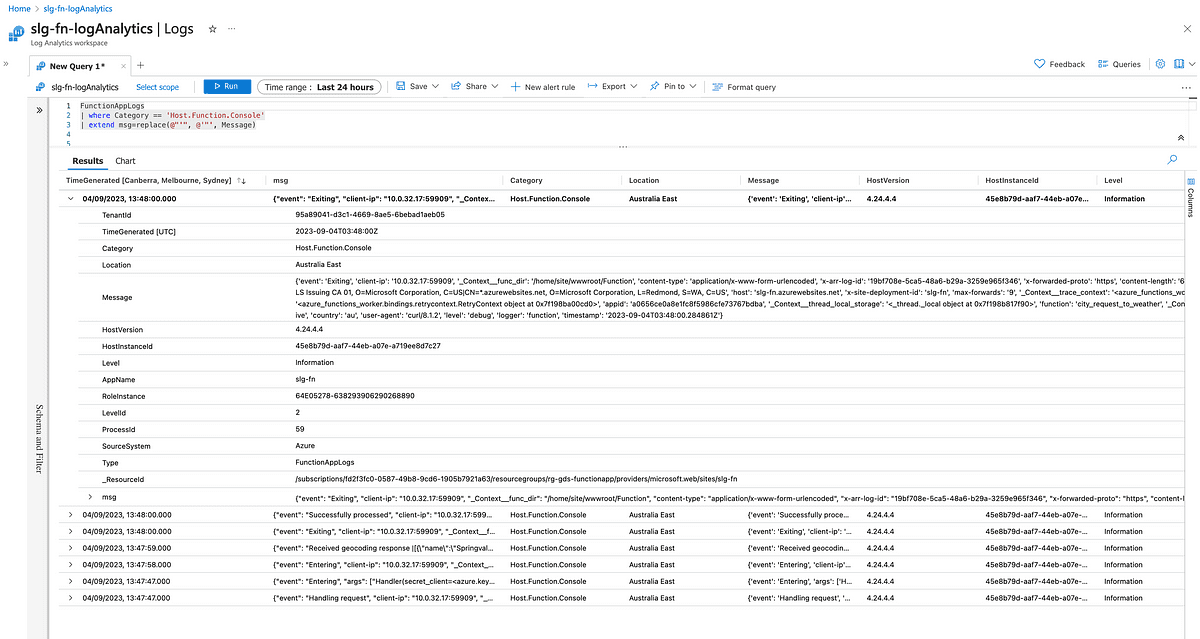
Let’s unpack JSON msg field we parsed out of the log message received by Log Analytics:
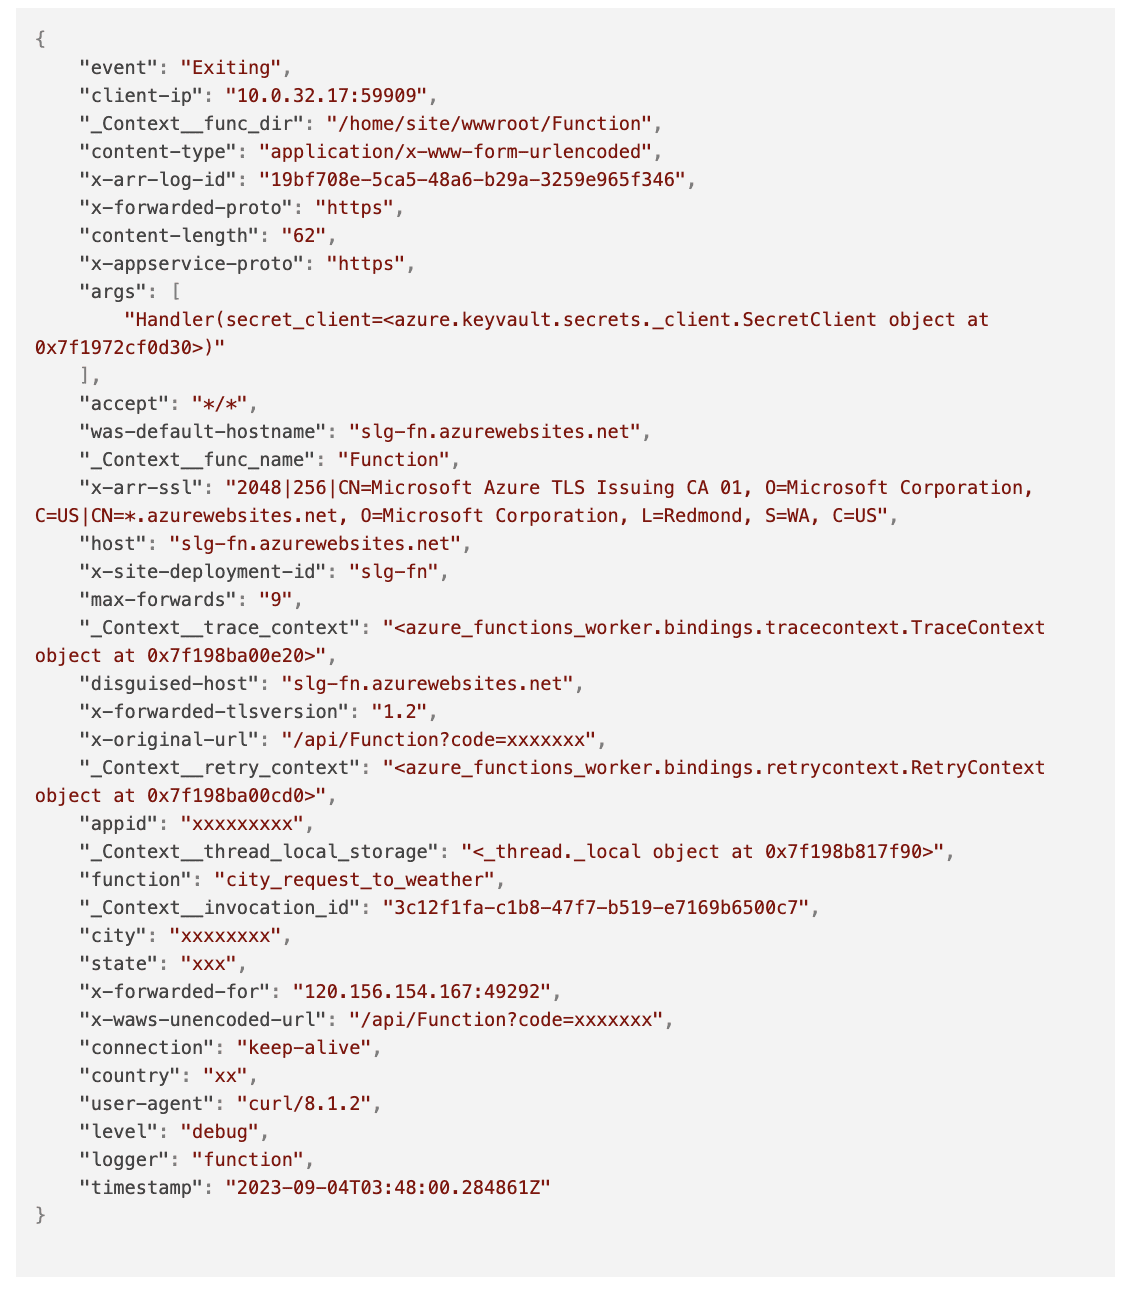
Metrics from Logs
Now that we have logs in Log Analytics, let’s measure latency.
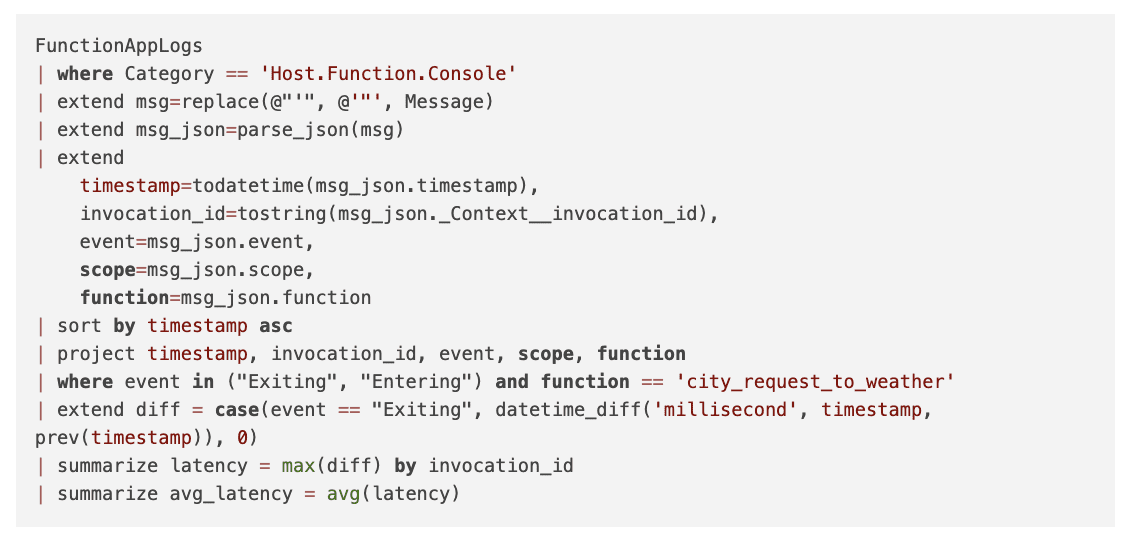
The query below leverages the Kusto language to provide latency (in millis) for the call to the city_request_to_weather function across all the requests.
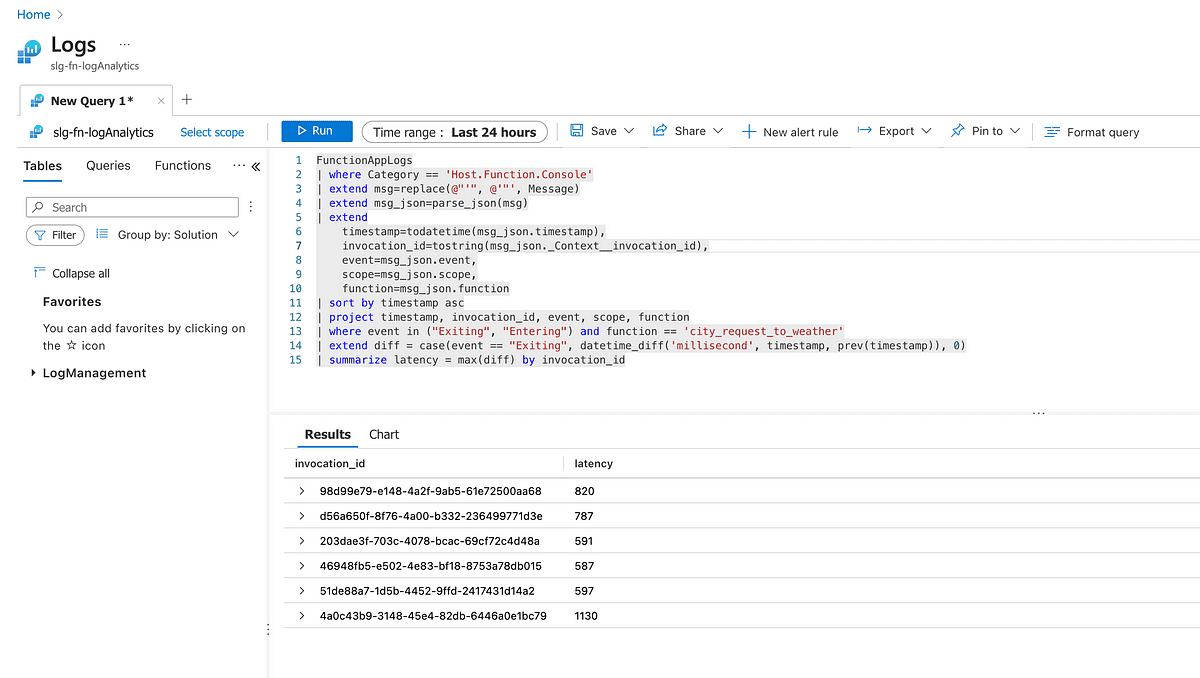
Let’s first see if we can calculate the latency experienced on a per-request basis. For this, we can extract and use the invocation_id.
Below is a screenshot of the query being executed in the Log Analytics Workspace
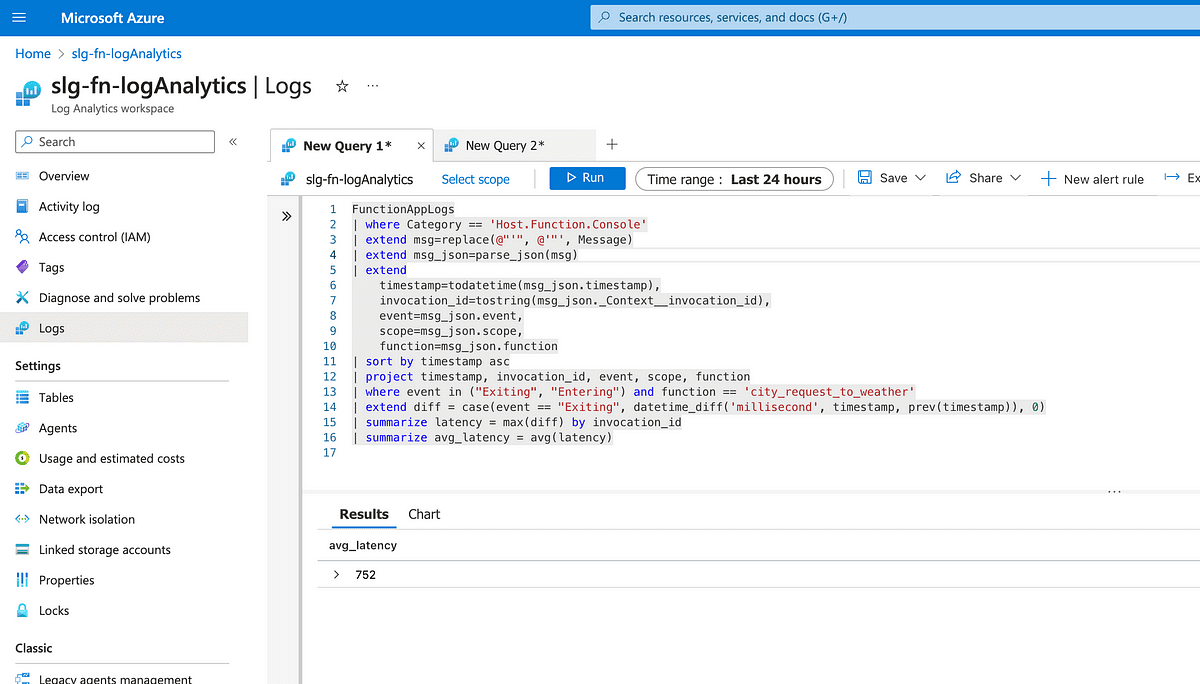
Then we can use Kusto to get the overall average latency across all the requests.
Alerts from Logs
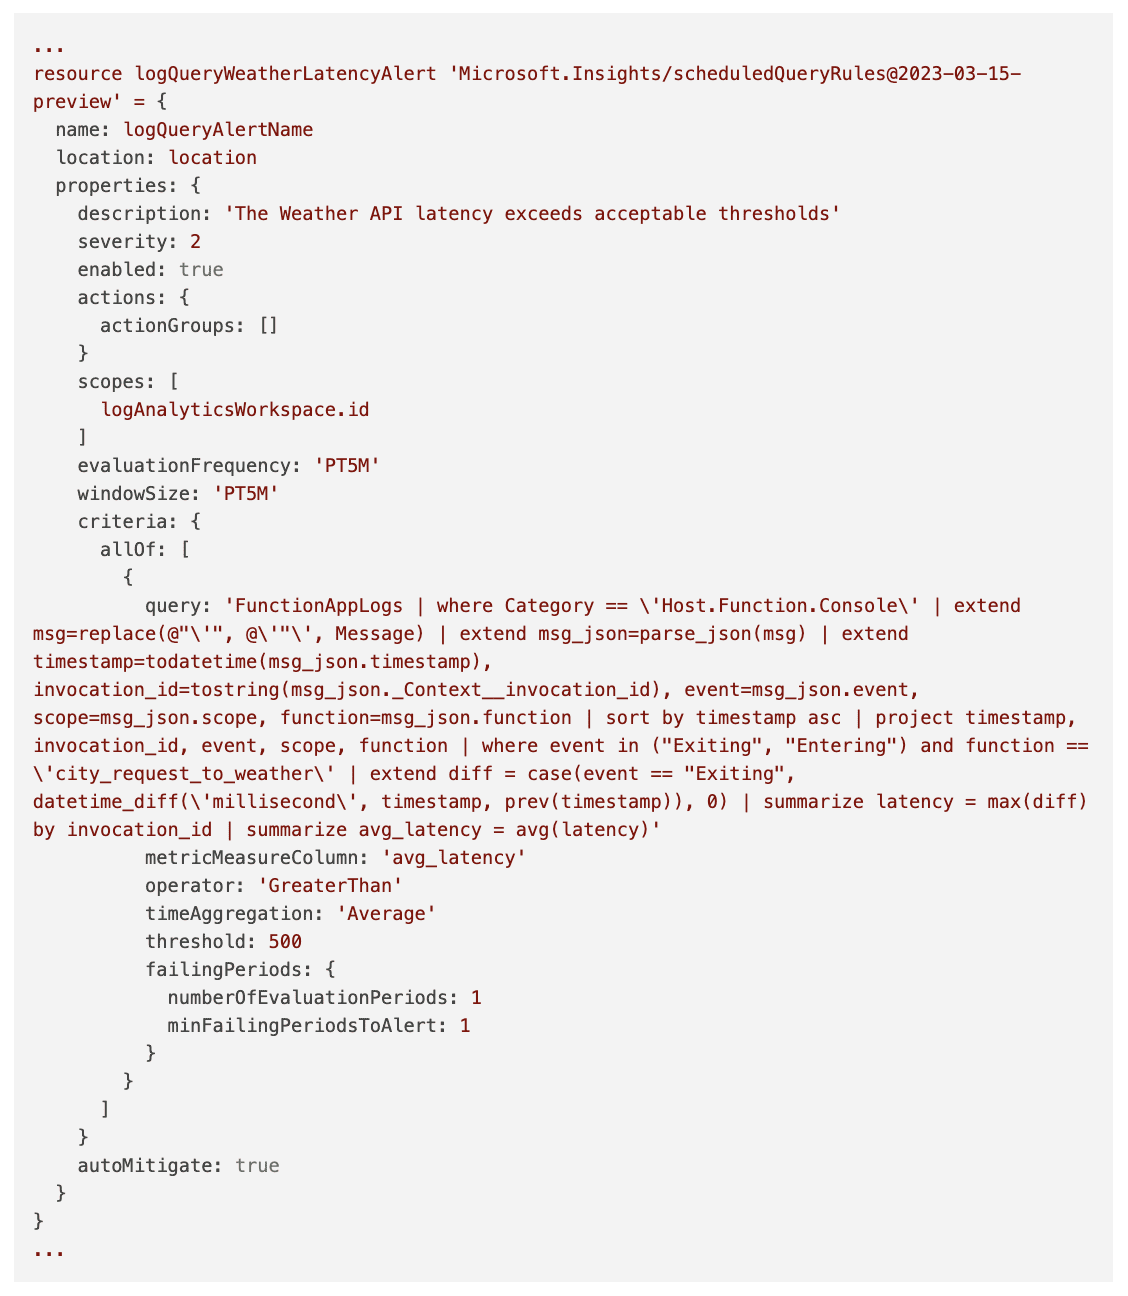
Let’s alert if the latency is above a certain threshold. By configuration, within Log Analytics, it’s possible to define an alert based on log metrics. Below is an extract from a bicep template containing the configuration.
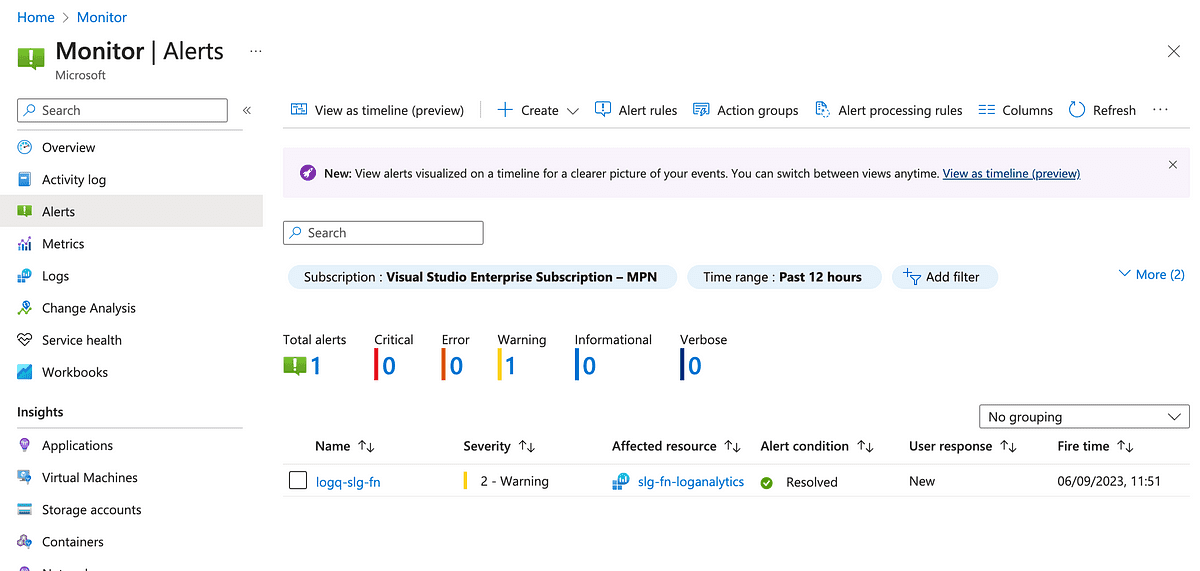
Let’s look at the alert in the UI.
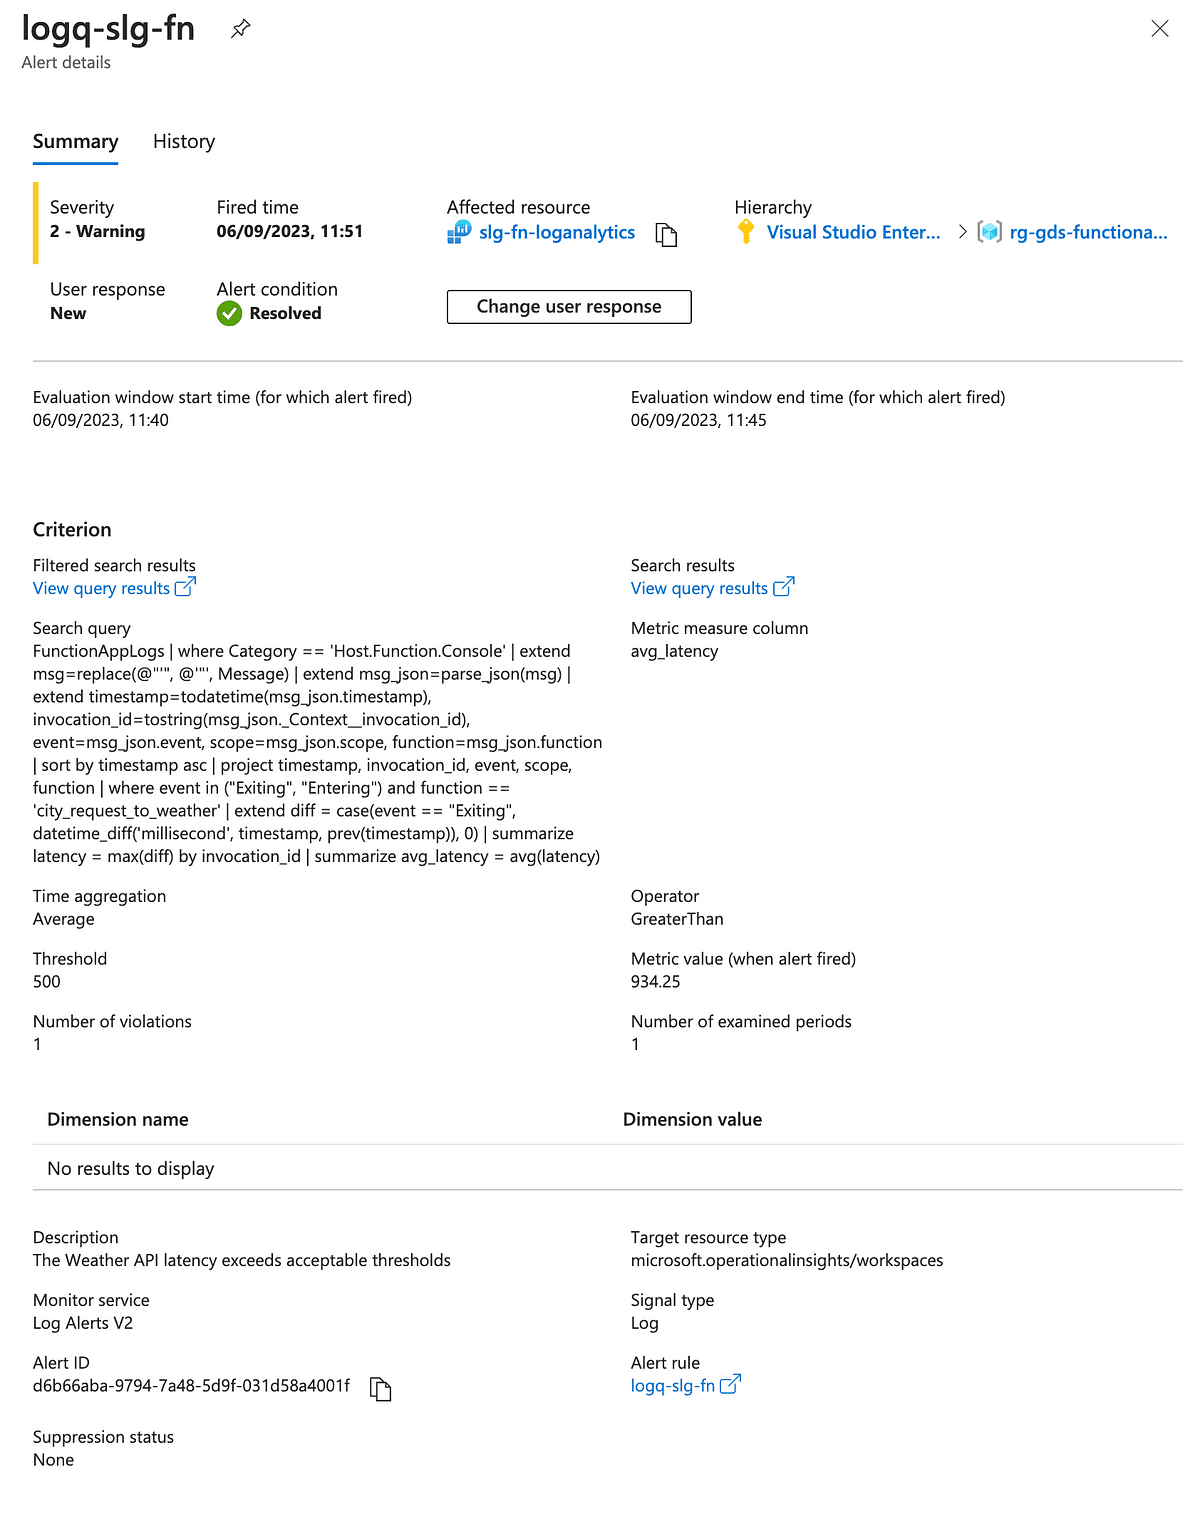
Details of the alert configuration are below.
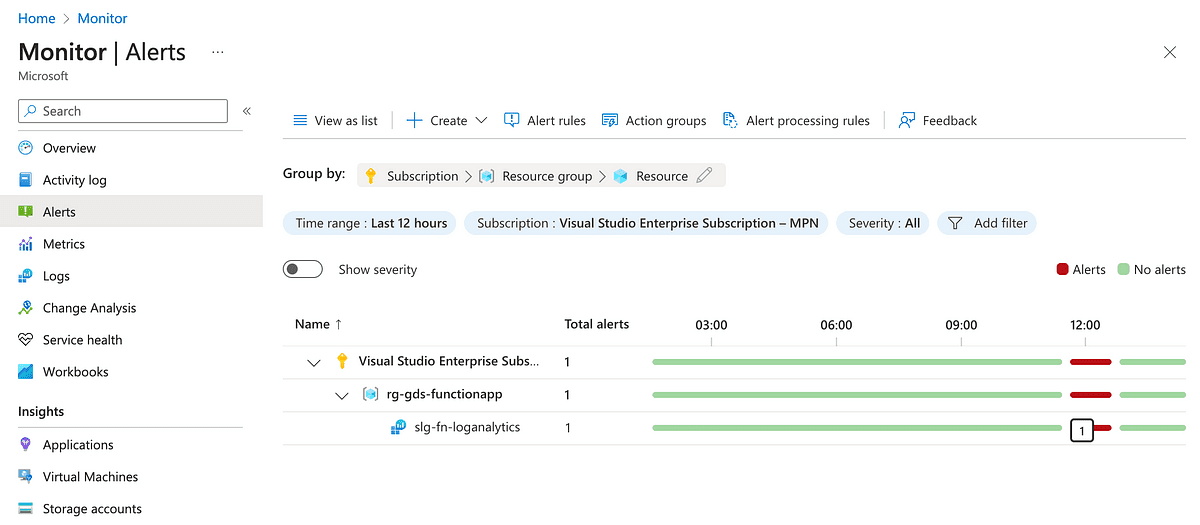
If we submit a request to the function app a few times and wait for the alert to be evaluated, we can observe that the alert gets raised.
Once the average falls below the threshold, it gets auto-resolved.
This type of query would not be possible unless we had structure, context and consistency in our log messages, and with these we can already see that we can extract more from logs than just diagnostics or a log trace.
Azure’s Analytic Ecosystem
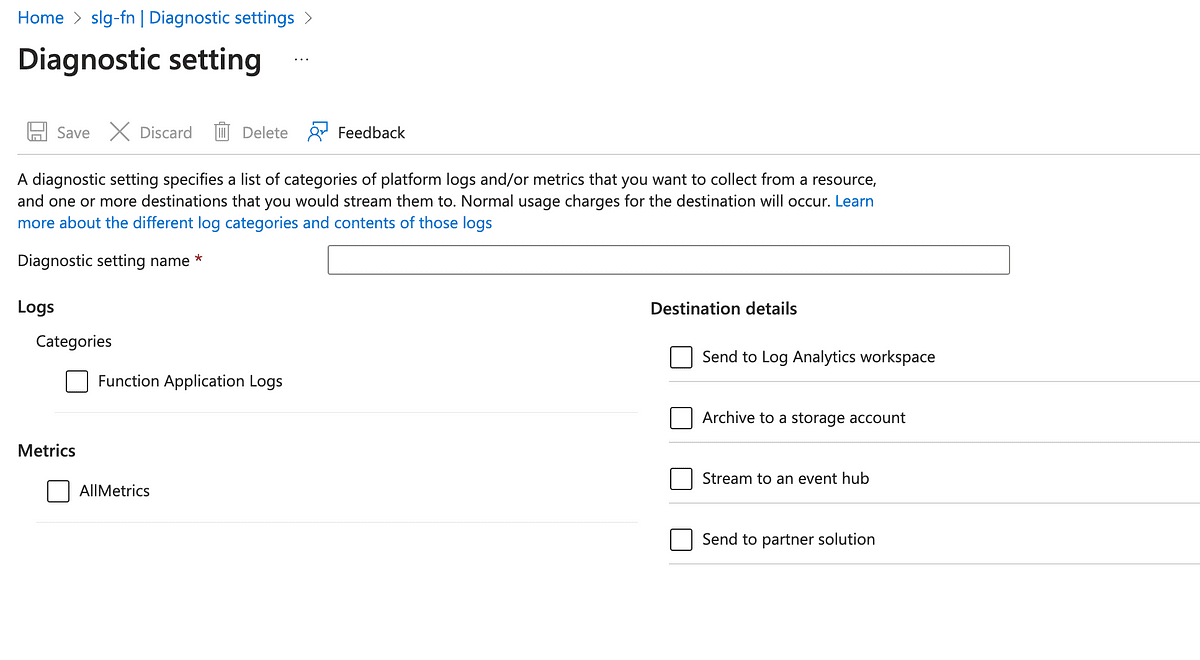
Within Azure, it’s possible to forward logs to a number of destinations.
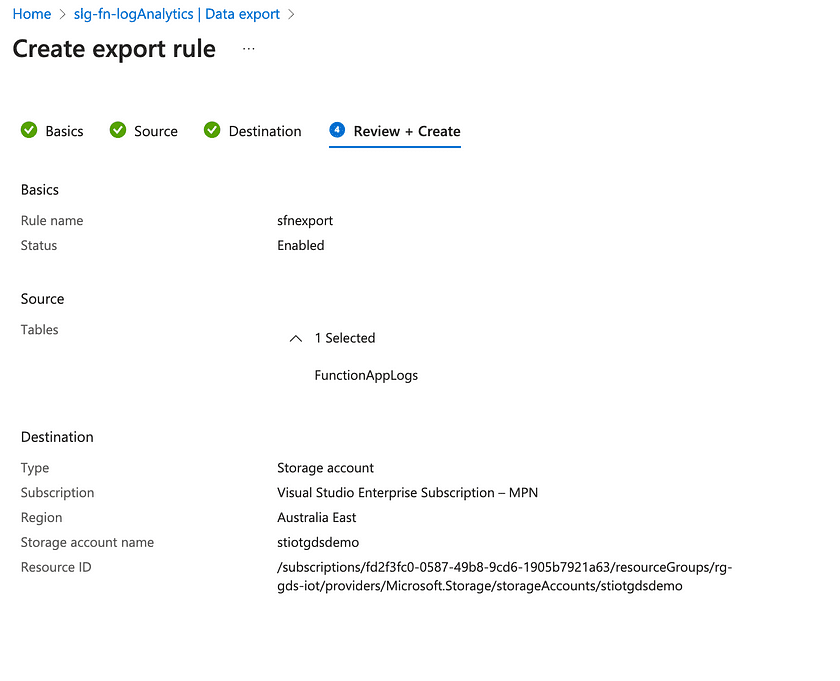
It is also possible to export logs to a storage account from Log Analytics via the Data Export functionality.
Once in a storage account, the log data can be ingested into Azure Data Explorer, Azure Synapse, etc. Also, via a streaming spark application in Azure Synapse, it’s possible to continuously ingest data from an EventHub destination into a Synapse SQL table for analysis using a dedicated or serverless SQL pool, leveraging full Synapse SQL rather than just Kusto. How to do this is outside the scope of this blog, but you can see where this can go.
Furthermore, if Azure already hosts your data warehouse using some of these technologies, logs are at your doorstep, and you haven’t left your cloud-native eco-system.
Overall:
In Azure, logs are easily integrated into a cloud-native capable, general purpose analytic tool. If these tools are already part of your data warehouse eco-system, the analytic value in logs is maximised and logs can readily contribute to a virtuous growth cycle.
Key Takeaways
I found the Azure, Python, Structlog and Log Analytics experience really cool.
Logs are data, a form of authentic, ground truth telemetry, that should be treated as value-carrying business events, but data quality in logs is chronically bad. Log analytic tools are necessary but expensive, and beyond diagnostics, we must extract analytic value to offset the costs, allowing logs to contribute to the virtuous growth cycle.
With Structlog and Python decorators we are able to improve the consistency of our log messages, while also addressing inherent context-smear and log littering, without diminishing our ability to manage the performance impact of fine grained logs, or developer discretion in relation to where to insert log messages.
Well-structured, high-dimensional, consistent, structured logs, in turn, maximise the extraction of both diagnostic and analytic value in logs via Azure Log Analytics with KQL while also preserving the single pane of glass, a key pillar of observability at scale.
With Azure’s analytic and event-based messaging eco-system, logs can be easily incorporated into a centralised data warehouse to further exploit data-centric governance, modelling and analytic capabilities that are already optimised to maximise the hygiene and analytic value of data.
How can Versent help?
Hopefully, this article gave you hope that app logging can be redeemed with the right mindset, tools and techniques.
If you want to know how to ship high-quality software into the cloud and maximise the value extracted from your data, reach out!
Whitepaper

Overseeing vs Overlooking AI
Versent’s white paper explores the growing gap between AI ambition and operational reality and why monitoring alone isn’t enough. Download it now for a practical view of AI observability, governance, and how to stay confident in what your AI is doing.