How to Ace Application Availability Using CDK Monitoring Constructs

Mark Wolfe
Practice Director for Cloud
Mark Wolfe
Practice Director for Cloud
What to monitor and how to get meaningful insights for a team using AWS serverless environments.
For anyone working in Amazon Web Services (AWS) serverless environments and facing the challenges of knowing what to monitor and how to get meaningful insights for a team, this will be near and dear to your heart.
So why is this hard at the moment?
AWS monitoring has historically been quite complex; the Amazon CloudWatch suite of products, such as metrics, log metric filters, and dashboards, is quite complex to configure and automate.
In addition to this, developers need some guidance on where to start when monitoring serverless solutions, as the sheer number of metrics available can be overwhelming, especially when you are encouraged to break components down into many small pieces.
If you just monitor all your serverless resources, it is easy to get overwhelmed by noisy alarms for things that are just transient or isolated failures.
There are also a lot of metrics that require tuning of thresholds, typically around rates or counts; a few errors are OK for a non-critical component that can be recovered. Or, in cases where a typical traffic flow is 100s per hour, you want to monitor for bursts, which may signal abuse.
So, in short, we want to reduce and avoid noisy dashboards that go from green to red continuously, as this leads to alarm fatigue, which in turn means the team just gives up and ignores the red dashboard.
So, How Do We Solve This Problem?
To avoid overwhelming a team with alarms, focus on starting by monitoring the key integration points within a solution.
Focus on monitoring a few key points of convergence in a system, such as:
- Amazon API Gateway, which provides serverless external or internal APIs
- AWS Step Functions workflows, which provide serverless job management.
When starting out, we can monitor both these services for errors and any other unexpected results.
The main goal is to start monitoring, identify any faults, and build up our monitoring to cover the things that matter. Monitoring of metrics should be added over time, as issues arise and incidents occur, but with a view to keeping the noise to a minimum.
So, How Do We Automate The Creation of Monitoring Resources?
For those familiar with AWS Cloud Development Kit (CDK), this provides an abstraction over the top of CloudFormation, with many pre-built patterns in the form of constructs, which aim to simplify the deployment of AWS services.
One of the handy open source CDK construct packages for CloudWatch is provided by CDK Monitoring Constructs, this project has pre-baked patterns for monitoring an array of AWS services, with many serverless, as well as databases such as Amazon Relational Database (RDS) and Amazon Redshift. For a complete list of what is supported, check out the features section of the README.md.
 // content api construct which defines the APIGW V2 and Lambdas
    const contentApi = new ContentApi(this, 'ApiGateway', props);

    // place holder alarm SNS topic to illustrate notifications
    const onAlarmTopic = new Topic(this, 'AlarmTopic');

    onAlarmTopic.addToResourcePolicy(
      new PolicyStatement({
        actions: ['sns:Publish'],
        effect: Effect.DENY,
        principals: [new AnyPrincipal()],
        conditions: { Bool: { 'aws:SecureTransport': false } },
        resources: [onAlarmTopic.topicArn],
      }),
    );

    const monitoring = new MonitoringFacade(this, props.stackName, {
      alarmFactoryDefaults: {
        actionsEnabled: true,
        action: new SnsAlarmActionStrategy({ onAlarmTopic }),
        alarmNamePrefix: props.stackName,
      },
    });

    monitoring
      .addLargeHeader('Content API')
      .monitorApiGatewayV2HttpApi({
        api: contentApi.httpApi,
        addLatencyP95Alarm: {
          Warning: {
            alarmNameOverride: formatAlarmName(props, 'latency-p95', {
              service: 'http-api',
            }),
            // thresholds need to be tuned for specific environment
            maxLatency: Duration.seconds(25),
            datapointsToAlarm: 1,
          },
        },
        add5xxCountAlarm: {
          Warning: {
            alarmNameOverride: formatAlarmName(props, '5xx-count', {
              service: 'http-api',
            }),
            // thresholds need to be tuned for specific environment
            maxErrorCount: 5,
            datapointsToAlarm: 1,
          },
        },
        add4xxCountAlarm: {
          Warning: {
            alarmNameOverride: formatAlarmName(props, '4xx-count', {
              service: 'http-api',
            }),
            // thresholds need to be tuned for specific environment
            maxErrorCount: 5,
            datapointsToAlarm: 1,
          },
        },
      })
      .monitorLambdaFunction({ lambdaFunction: contentApi.indexFunction });

    new CfnOutput(this, 'AlarmTopicArn', {
      value: onAlarmTopic.topicArn,
    });

    new CfnOutput(this, 'Dashboard', {
      value: monitoring.dashboardFactory.getDashboard.name,
    });
So, this code creates an Amazon CloudWatch Dashboard, which centralises the monitoring, typically for each service, depending on the scale of the solution. This dashboard includes notations for alarm thresholds, which is quite complex, given the nature of the dashboard markup.
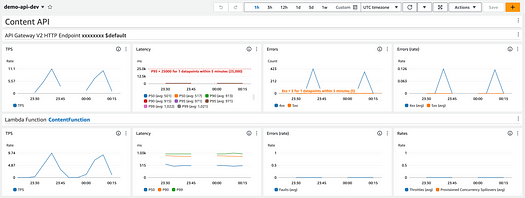
This code also configures some inbuilt Cloudwatch Alarm templates provided by the monitoring constructs. The alarms are automatically added as thresholds on the dashboard to simplify tuning. To provide more context for operators, we use a standardised name format, as seen in the figure below.
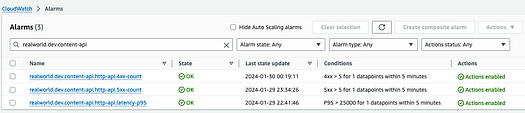
To bring these alarms to the attention of your team, you can route these alarm events directly through Slack or Teams or via services such as AWS ChatOps. We chose to route events through an enrichment lambda, which adds tags and other information to the alarm events. More on this in a future blog post …
Conclusion
So, in summary, these constructs enable developers to add monitoring and a central dashboard to services with minimal effort while also providing a lot of value by automating some rather complex AWS services.
For those interested in how we implemented monitoring for existing CDK Projects. We found decoupling the application code from this library and using SSM to reference existing resources worked really well. This solution can work with existing resources, exported via CloudFormation (not ideal due to lifecycle issues), or discovered via AWS Systems Manager Parameter Store using the handy CDK fromStringParameterName in the StringParameter (construct).
Whitepaper

Overseeing vs Overlooking AI
Versent’s white paper explores the growing gap between AI ambition and operational reality and why monitoring alone isn’t enough. Download it now for a practical view of AI observability, governance, and how to stay confident in what your AI is doing.