CloudWatch RUM + X-Ray: The Underrated Duo for Cloud Native Observability

Shaun Clements
Shaun Clements
The Underrated Duo for Cloud Native Observability
Lightweight, Low Complexity Cloud Native Tracing
TL;DR: Native is always my goto path when evaluating what is the most simple and cost-effective approach. When it comes to Observability tracing for a web application, AWS Cloudwatch RUM & AWS X-Ray when combined, offer really powerful insights into your platform services from user behaviour perspective.
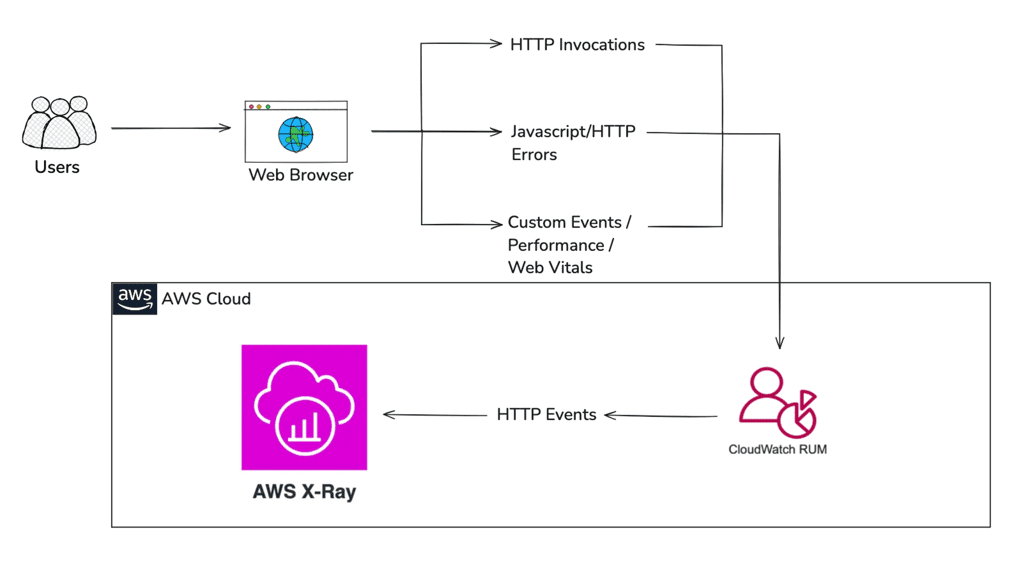
With modern application architectures distributed across numerous technologies and broken down into microservices, tracing is hard. When a user request from a website is invoked, a modern run and maintain team investigating an incident raised, will often want to know:
- when was the request invoked
- what actions were performed across AWS services
- how long did it take to process each request
- were there any errors reported in the client (javascript) or from network request (http)
- events including client interactions to view the sequence/parallel actions performed
With Cloudwatch RUM enabled web clients, along with X-Ray enabled AWS Services you are able to view all the above. This blog aims to show you how easy it is to get started and uplift your current observability practices.
Cloudwatch RUM
CloudWatch RUM (Real User Monitoring) is an APM (Application Performance Monitoring) feature from AWS, introduced April 2021 under CloudWatch’s Application Signals. It helps developers understand how their web applications are performing from the perspective of actual users. It collects data on user interactions, page load times, errors, allowing teams to identify performance bottlenecks and improve the overall user experience.
What it does:
- Monitors real user interactions with web applications.
- Provides insights into performance metrics such as page load times and error rates.
- Helps in diagnosing issues affecting user experience.
- Integrates with AWS X-Ray for end-to-end tracing
AWS X-Ray
AWS X-Ray is a powerful service that helps developers trace, analyze and debug distributed applications, particularly those built using microservices architecture. It provides insights into the performance of applications by tracing requests as they travel through various services, allowing teams to pinpoint bottlenecks and troubleshoot issues effectively.
What it does:
- Traces requests across multiple services to provide a comprehensive view of application performance.
- Visualizes service maps to identify dependencies and interactions between services.
- Captures detailed information about requests, including latency and error rates.
- Integrates seamlessly with other AWS services, enhancing observability and debugging capabilities.
By utilizing AWS X-Ray, developers can gain a deeper understanding of their application’s behavior, leading to improved performance and user satisfaction.
Since authoring this blog, AWS have announced X-Ray is transitioning to OpenTelemetry (OTel) as its primary instrumentation standard for application tracing and observability. A future revision of the blog can be expected.
How to get started
1. Creating the Cloudwatch RUM ‘App Monitor’ in AWS Cloud
Add a Cloudwatch RUM AppMonitor in your AWS account enabled for XRay
Note: There are a number of additional telemetries you may also want to enable.
E.g. Using CDK below you could capture telemetries such as Errors, HTTP requests and enable X-Ray trace capturing.
new CfnAppMonitor(this, `RumAppMonitor-{envName}`, {
domain: domainName,
name: `RumAppMonitor-{envName}`,
customEvents: {
  status: "ENABLED"
},
appMonitorConfiguration: {
  allowCookies: true,
  enableXRay: true,
  sessionSampleRate: 1,
  telemetries: ['errors', 'http']
}
})
ref: Creating a CloudWatch RUM app monitor for a web application — Amazon CloudWatch
2. Provision an Identity Provider and Role for signed in Web client users to use to push RUM events in your AWS Account
In order for a web client to push RUM messages to your RUM App monitor, the authenticated web user will use their JWT token, and the STS client to assume a role in the AWS workload account.
This particular requirement isn’t well documented and involves creating an OIDC Identity Provider along with a relevant role which is assumed by the FederatedPrincipal.
E.g. using CDK
const oidcProvider = new aws_iam.OpenIdConnectProvider(this, 'oidcProvider', {
  url: //issuer url for the Identity Provider,
  clientIds: ["XXXX-XXXX-XXXX-XXXX"] // registered idp client identifier
}

const role = new aws_iam.Role(this, 'rumAssumeRole', {
  assumedBy: new aws_iam.FederatedPrincipal(
    oidcProvider.openIdConnectProviderArn,
    {
      StringEquals: {
        [`issuer url:aud`]: "XXXX-XXXX-XXXX-XXXX"//clientId
      }
    },
    'sts:AssumeRoleWithWebIdentity',
    ),
  inlinePolicies: {
    rumPolicy: new aws_iam.PolicyDocument({
      statements: [
        new aws_iam.PolicyStatement({
          effect: awsm_iam.Effect.ALLOW,
          actions: ['rum:PutRumEvents'],
          resources: [`//arn of Rum App Monitor`]
        })
      ]
    }})
  }
  )
}})
3. Add the RUM SDK Client to your React web application
Start with creating and configuring your Cloudwatch RUM client in your web application ideally using the React Provider pattern.
Wrapping your React pages with the Rum Provider will automatically capture the telemetries specified across child pages with the option to still manually record custom events. E.g. Using npm package: https://www.npmjs.com/package/aws-rum-web
const rumClient = new AwsRum('7b85c38a-3518-4047-9e1b-438e3a75531b', //Guid of the AppMonitor provisioned in your AWS account
'1.0.0',
region,
{
  sessionSampleRate: 1,
  endpoint: `https://dataplane.rum.${region}.amazonaws.com`,
  enableXRay: true,
  allowCookies: true,
  telemetries: [
    ['errors', { stackTraceLength: 512}],
    ['http', {
      stackTraceLength: 512,
      addXRayTraceIdHeader: true,
      recordAllRequests: true,
      urlsToExclude: [
        new RegExp(`https://dataplane.rum.${region}.amazonaws.com/.+`) //prevent RUM events traced in XRay
      ]
    }]
  disableAutoPageView: true
}
})

const credentials = stsClient.send(
  new AssumeRoleWithWebIdentityCommand({
    RoleArn: "", //Arn of the rumAssumeRole
    RoleSessionName: "Rum Assume Role"
    WebIdentityToken: "" // IdentityToken of the signed in User
  })
)
rumClient.setAwsCredentials(credentials)

// You're now good to start pushing Rum Events!
rumClient.recordEvent("My Custom Event", { timestamp: Date.now()})
The STS SDK Client does not currently support token renewal when it expires so its up to you to include renewal functionality in your web client code.
4. Enable X-Ray for all your AWS supported services
Turn on X-Ray support for all AWS supported services you wish to trace.
What does the data actually look like?
CloudWatch RUM provides several key data points:
Performance Metrics
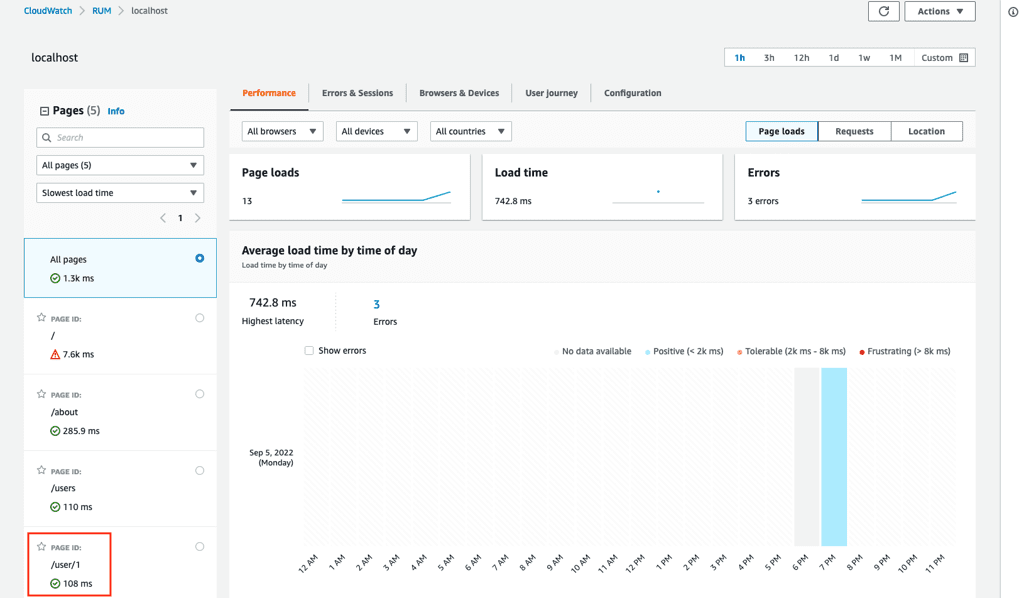
Page Load Time: Measures the time taken for a page to fully load, providing insights into how quickly users can interact with the application.
- First Contentful Paint (FCP): Indicates the time it takes for the first piece of content to be rendered on the screen, which is crucial for user perception of speed.
- Time to Interactive (TTI): Measures how long it takes for a page to become fully interactive, allowing users to engage with the application.
- Error Rates: Tracks the frequency of errors encountered by users, including JavaScript errors and HTTP request failures, helping teams identify and resolve issues quickly.
- User Interaction Metrics: Captures data on user interactions such as clicks, scrolls, and navigation events, providing a comprehensive view of user engagement.
- Session Duration: Measures the length of time users spend on the application, which can indicate user satisfaction and engagement levels.
- Geographic Distribution: Provides insights into where users are accessing the application from, helping teams understand performance variations across different regions.
Errors
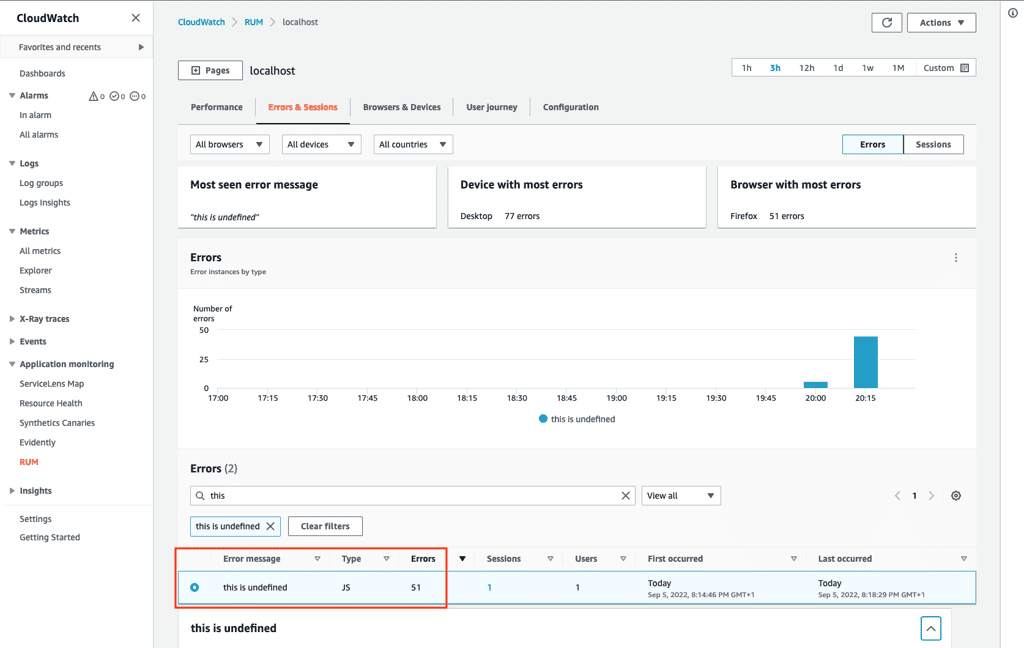
CloudWatch RUM also provides detailed insights into errors that occur during user interactions. This includes:
- JavaScript Errors: Captures any errors that occur in the client-side JavaScript code, allowing developers to identify and fix issues that may affect user experience.
- HTTP Request Failures: Monitors failed HTTP requests, providing information on the status codes returned and the context of the failures.
- Error Rate Trends: Analyzes trends in error rates over time, helping teams to understand if issues are becoming more frequent and to prioritize fixes accordingly.
- User Impact: Identifies which users are affected by specific errors, allowing teams to address critical issues that impact user satisfaction.
X-Ray Traces
AWS X-Ray traces provide a detailed view of the requests made to your application, allowing developers to analyze and debug issues effectively. When integrated with CloudWatch RUM, X-Ray can enhance observability by correlating user interactions with backend service performance.
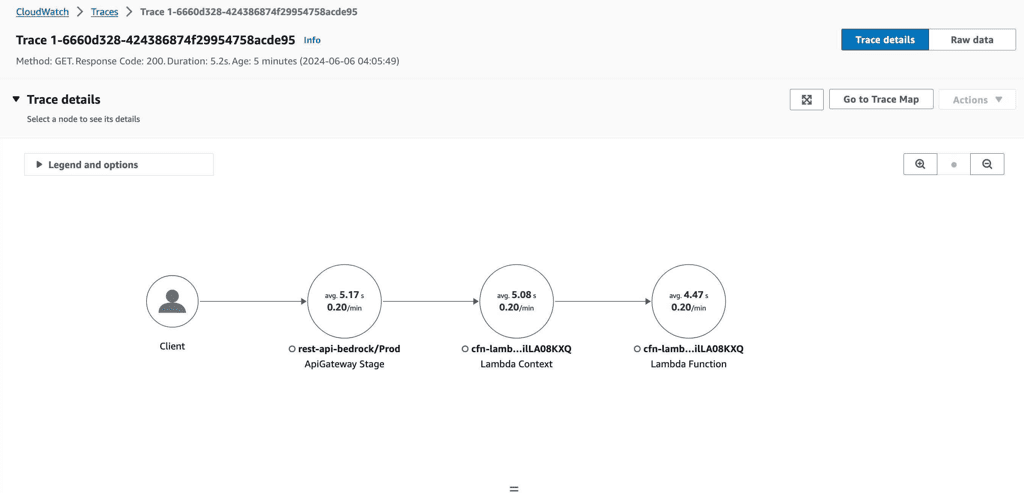
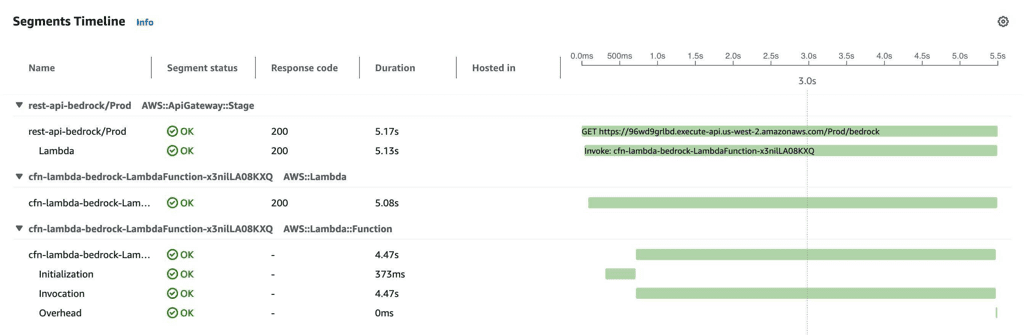
How X-Ray Traces Work with CloudWatch RUM
- Correlation of Data: When a user interacts with a web application monitored by CloudWatch RUM, the RUM service injects a
X-Amzn-Trace-Idheader and collects telemetry data. This header is crucial for correlating user actions with X-Ray traces, enabling a comprehensive view of the request lifecycle. - Tracing Requests: As requests travel through various microservices, X-Ray captures detailed information about each segment of the request. This includes latency, errors, and service interactions, providing insights into where bottlenecks may occur.
- Visualizing Performance: X-Ray visualizes the flow of requests through your application, allowing teams to identify dependencies and interactions between services. This visualization helps in pinpointing performance issues and understanding the overall health of the application.
- Error Analysis: By analyzing X-Ray traces alongside CloudWatch RUM data, teams can identify which user interactions lead to errors and how those errors impact user experience. This dual perspective is invaluable for troubleshooting and improving application reliability.
- Enhanced Debugging: The integration of CloudWatch RUM and X-Ray allows developers to trace issues back to specific user actions, making it easier to diagnose problems and implement fixes. This leads to a more responsive and user-friendly application.
The bottom line
Getting meaningful observability into your web application doesn’t have to mean adopting complex third-party tooling. By combining CloudWatch RUM and AWS X-Ray, you get a lightweight, native solution that connects real user behaviour directly to backend service performance — from a client-side JavaScript error all the way through to a downstream microservice call.
The four-step setup is straightforward, the data it surfaces is immediately actionable, and it integrates naturally into an existing AWS workload. If you’re running a modern web application on AWS and observability is still an afterthought, this is one of the lowest-effort, highest-value uplifts your team can make