Can you observe everything with your monitoring?

Justyn Green
Principal Solution Architect, Cloud Adoption
Justyn Green
Principal Solution Architect, Cloud Adoption
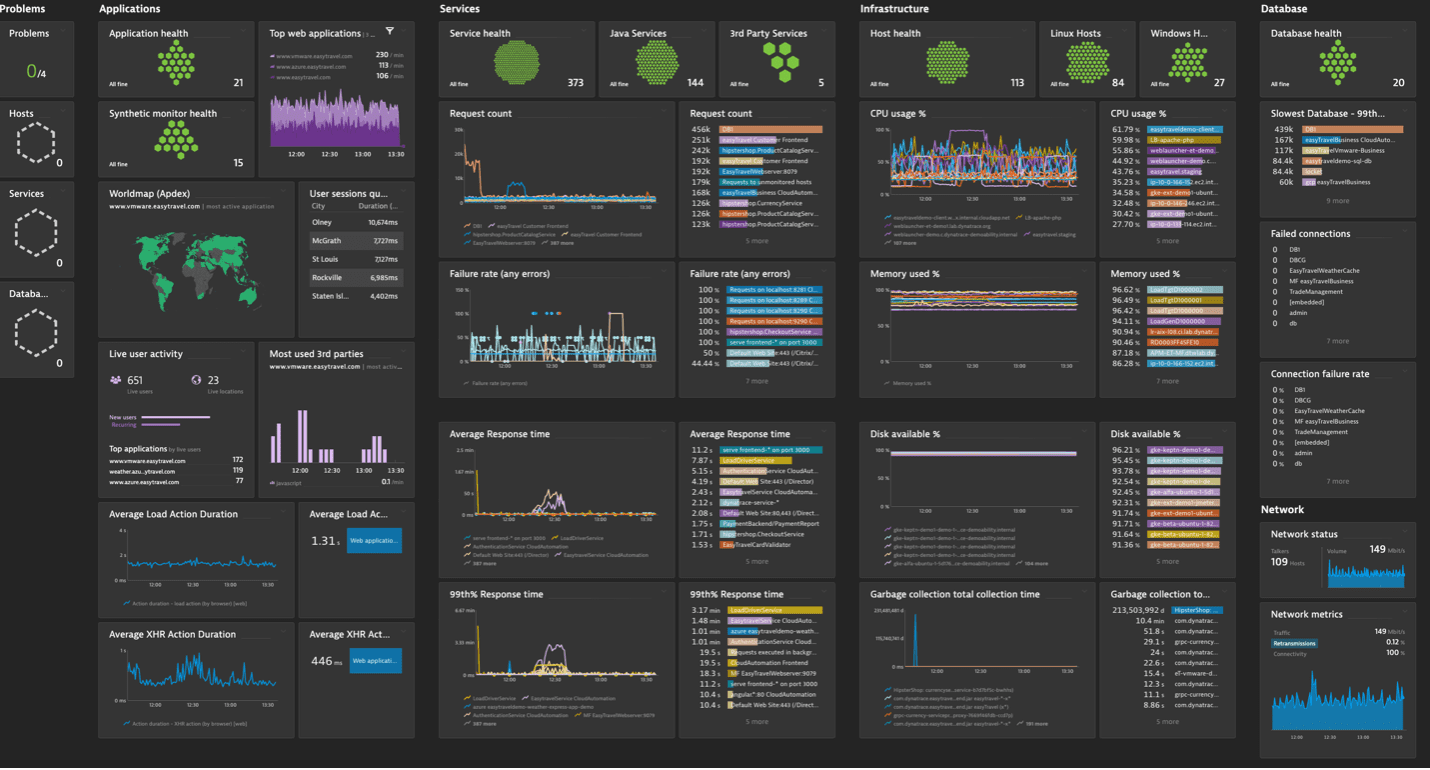
Isn’t observability just enhanced monitoring? Well, monitoring tells you that a service or server is healthy. But what if a service is slow, hangs, or is only partially responding? How does that help customers? It doesn’t. It’s annoying, frustrating, and ultimately ends with users having a poor experience. Observability understands a service and all its transactions behind the scenes.
Versent overcomes these challenges with customers regularly. In this article, we’ll discuss a 4-stage process of using the Dynatrace Software Intelligent Platform to unlock reporting and observability across an entire application fleet.
Dynatrace® combines broad and deep observability with continuous runtime application security with the most advanced AIOps to provide answers and intelligent automation from data at enormous scale. Dynatrace can be installed on-premises and has a self-service management overhead, whereas the Dynatrace SaaS platform is managed and has release controls every 2 weeks with product and features that helps operate seamlessly with capabilities all organisations can benefit from.
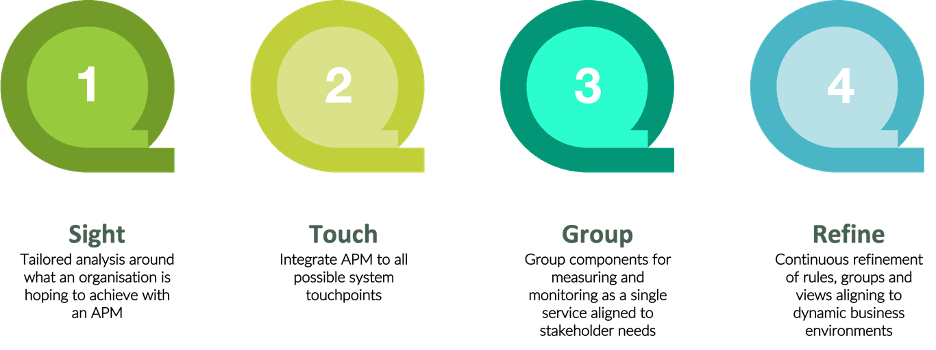
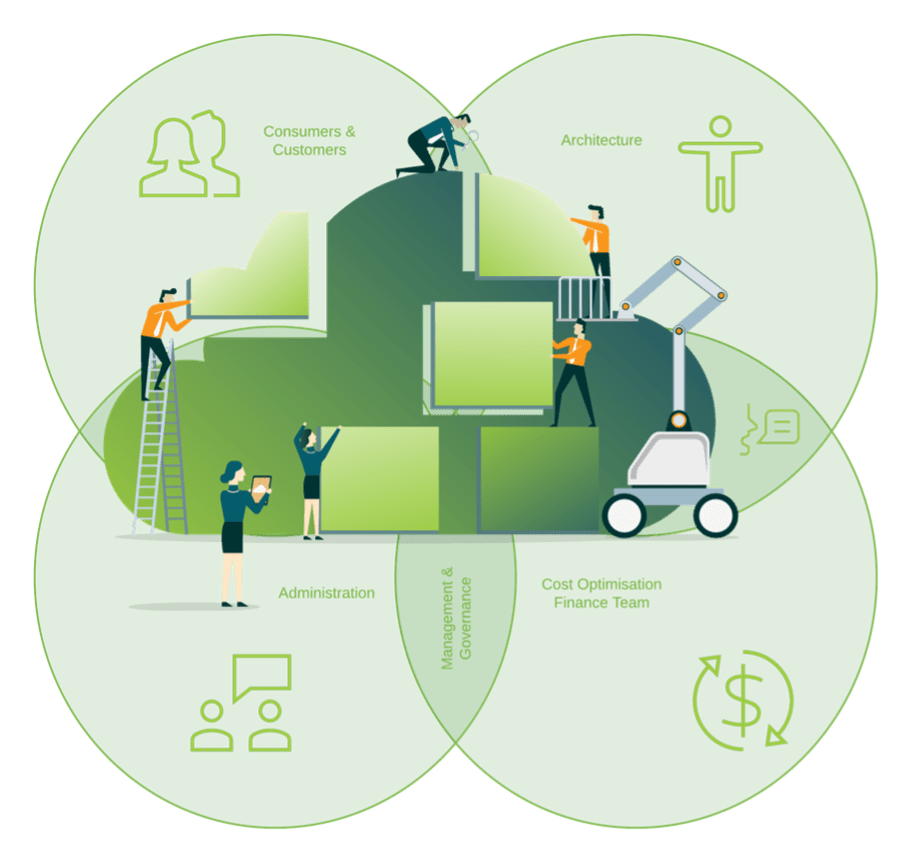
Diagram 1: Versent’s 4 stage approach to addressing onboarding and optimising for Application Performance Monitoring (APM) and Observability with Dynatrace
With the evolution of multiple cloud platforms, there are several challenges to ensure there’s an appropriate level of visibility into what applications are doing. Benefiting from native services across various platforms, the principles of observability and monitoring are often similar but how they are configured can be wildly different from platform to platform.
When it comes to monitoring and reporting with a tiered approach to alerting, it’s crucial to be clear about how to ensure environment stability functions regardless of the application type. However, when introducing observability, the tiered approach is irrelevant and the usage of relationships between services becomes equally if not more important than that of environment stability.
Versent prefers to use Dynatrace® as the configuration entry point into an organisation as it has a lower overhead onboarding process, more insightful reporting, and visibility can be introduced over time as administrators and consumers become more familiar with the platform.
Traditional monitoring
The 2022 Gartner Magic Quadrant for Application Performance Monitoring (APM) and Observability recognized Dynatrace as a Leader, positioned furthest for Completeness of Vision. The report focuses on how APM and observability tools have become powerful analytics platforms that ingest multiple telemetry feeds, providing critical insight into application performance and looks specifically at the differences among the vendors in the market.
Application Performance Monitoring & Observability
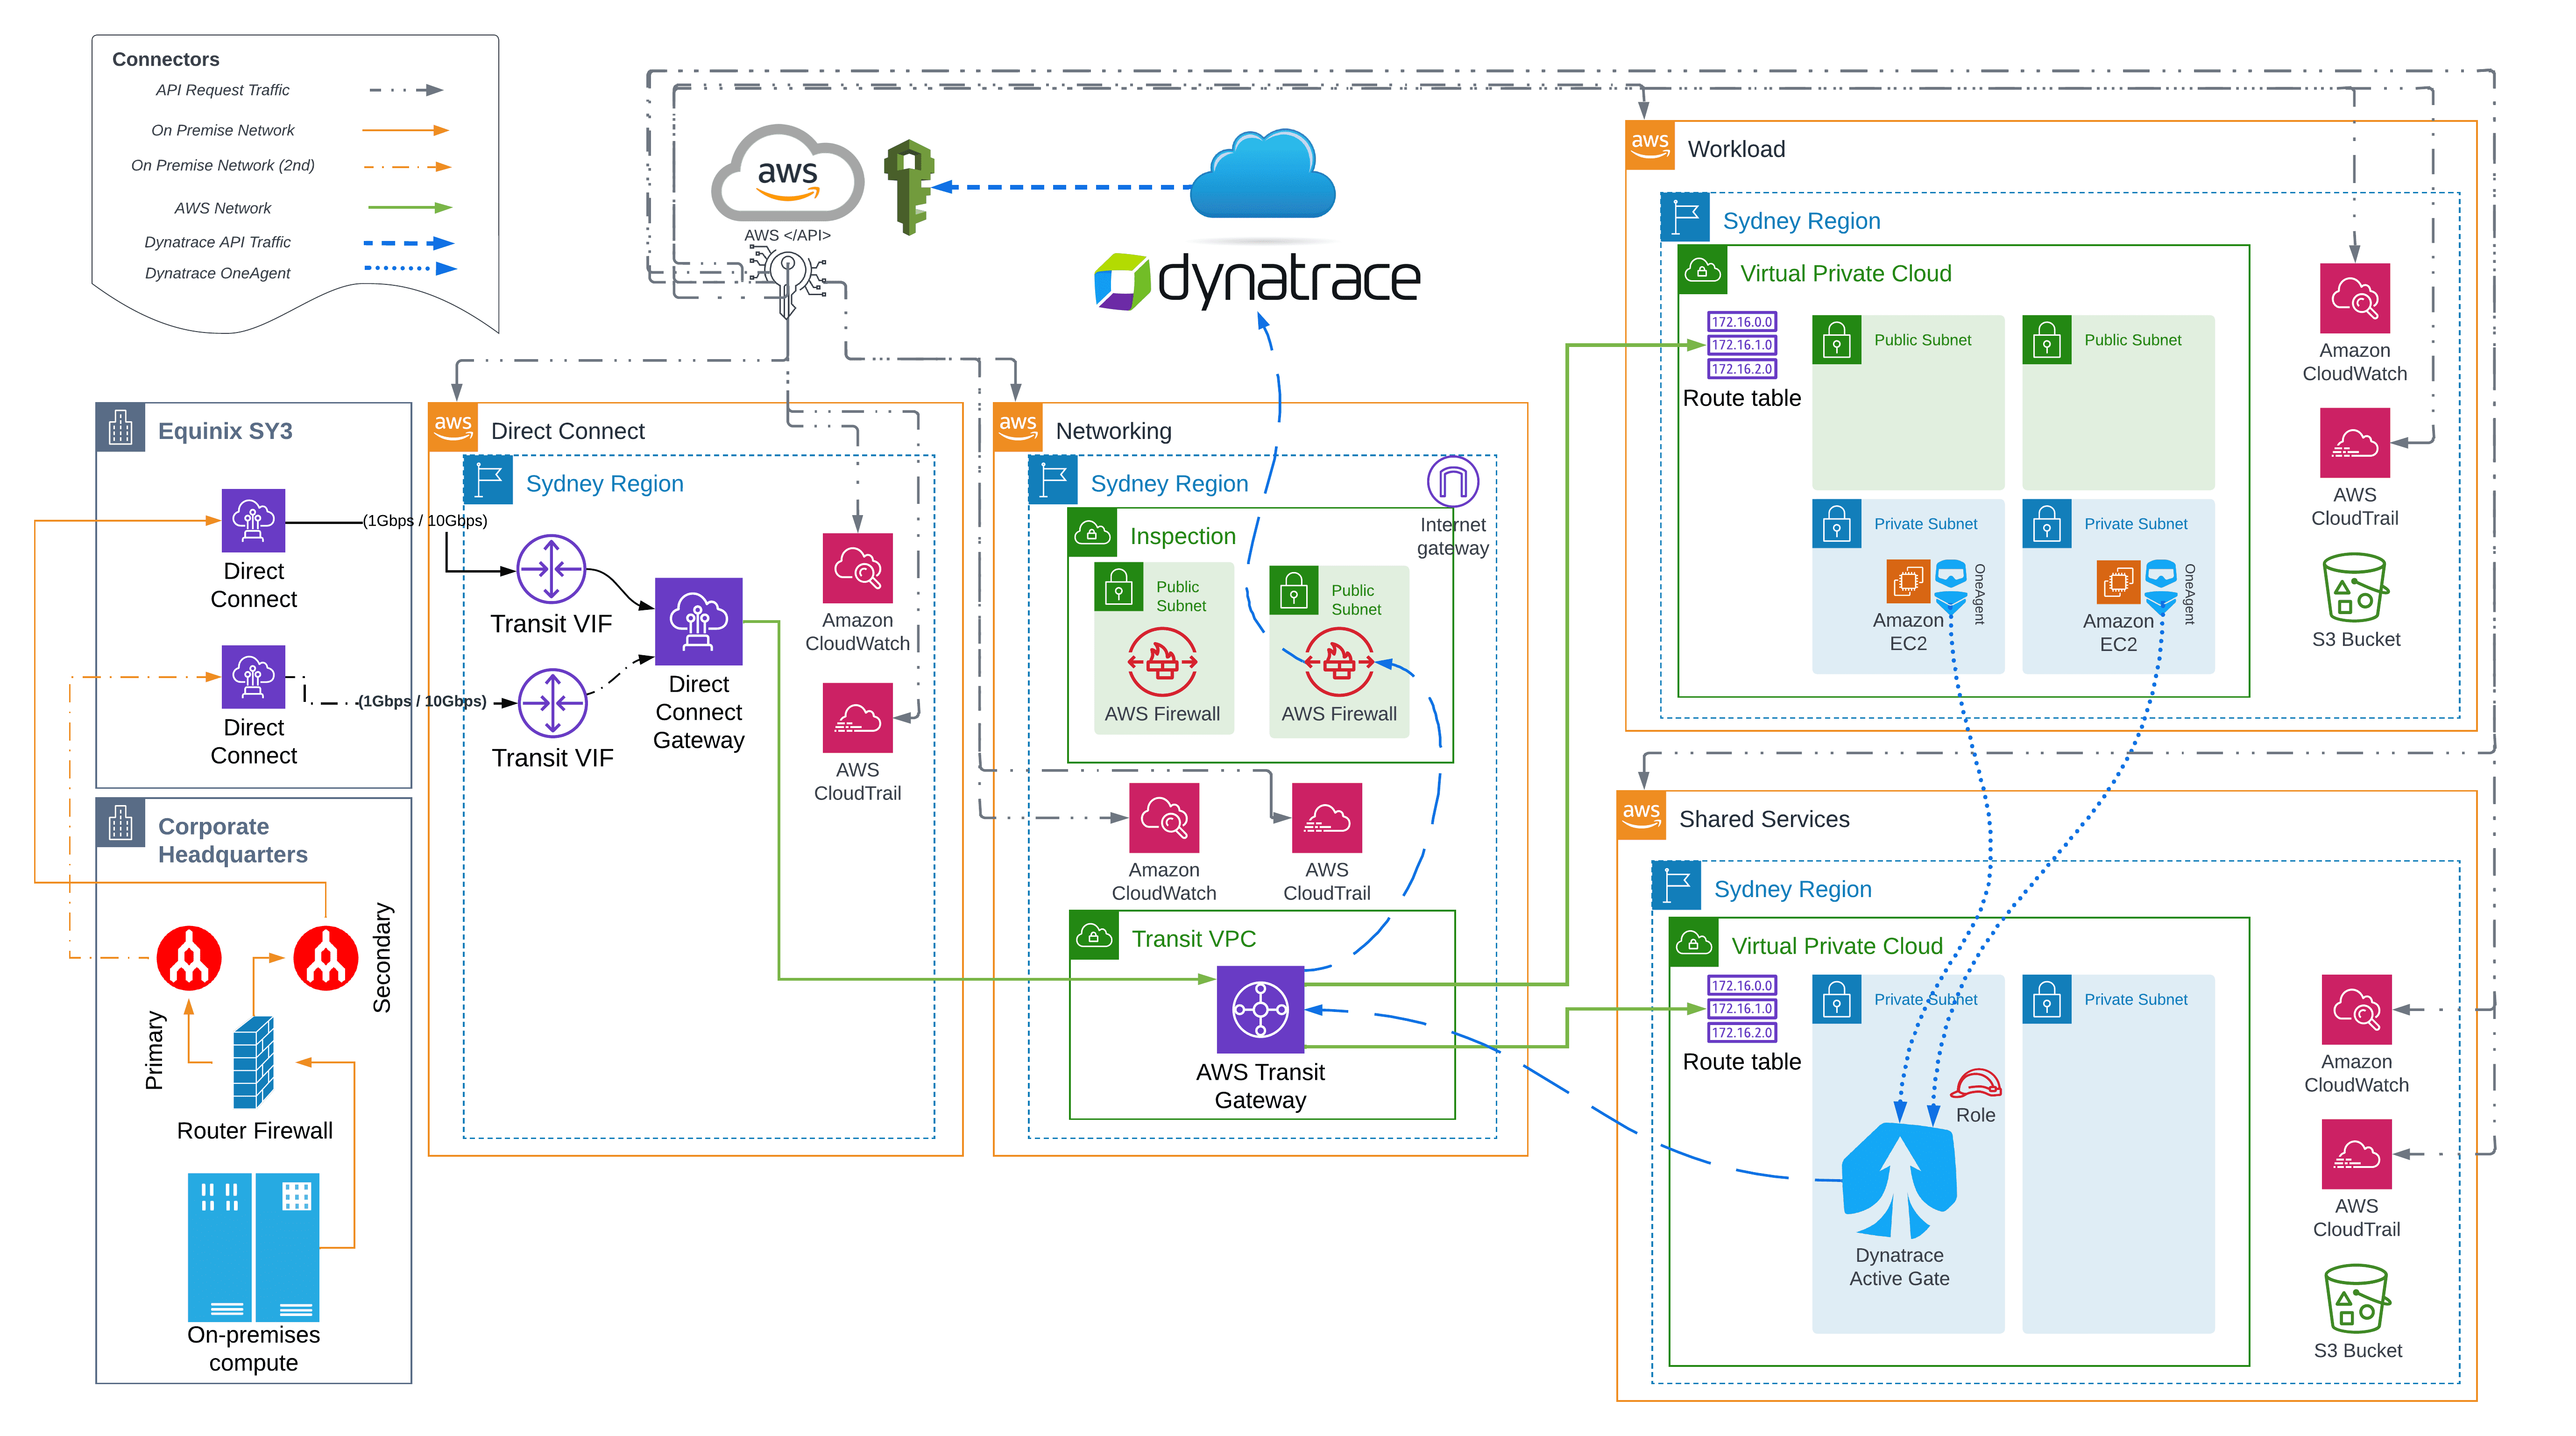
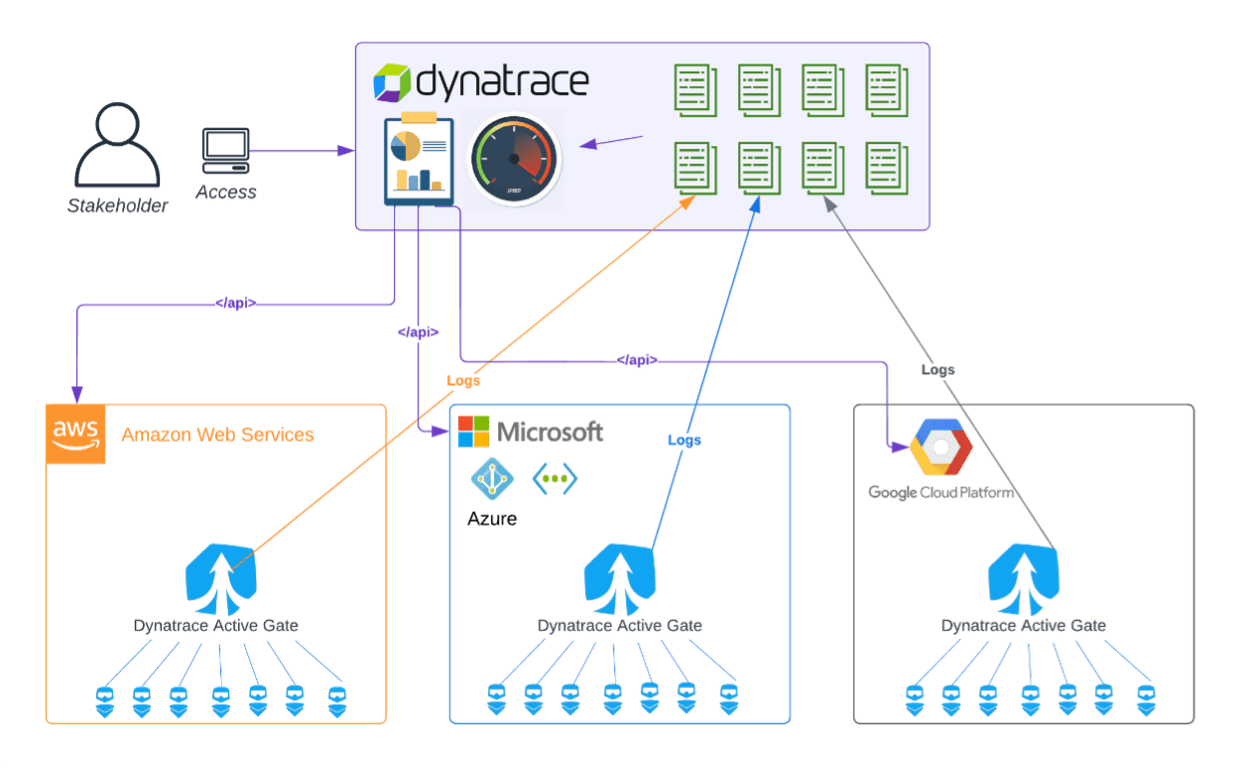
Diagram 2: Dynatrace High Level Overview (AWS)
Stage 1: Sight
Versent begins every APM assessment with a question.
“What do you want to achieve?”
It’s important to tailor any effort towards what is the most important item first so it’s straightforward to then peel back the layers of an application operating model.
With this objective, performing an upside-down inventory of an application, you can apply a courtesy score card of its value and importance.
A sample score card may look like the below:
- Prod Database = Yes
- Prod Data Store = Yes
- Non-Prod Data Store = No
- Dev Management Server = No
- Prod Transaction Path = Yes
- Etc.
During this exercise, the important components and workloads that provide value to an organisation should be classified as initial targets, as this would provide immediate return on value and begin showing new and robust visibility. Please note: This is a selective process, and it is NOT recommended to ear mark everything as Yes or High. This would prevent agile and iterative adoption.
NB: Starting small on understanding your core objective helps get the quick wins to do better.
Build
Stage 2: Touch
Versent has experience with many different application landscapes, and it is a common thread that all services in an organisation at some small touch point depend on another service or integration.
During any assessment, it’s common to be focused on an application stack as a single group of objects and treat it as a self-contained collection. Sometimes this analysis exercise leads to missing an integration or connection that is often, crucial to operations.
Versent exercises great effort to capture these touch points, even if they are not part of the application landscape (or are available within an environments control). With this breadth considered, Versent ensures that long life connections are identified and classified through groupings and applicable services that are operational or running.
The user impersonation features that unlock this mystery around application behaviour enables reporting to be more meaningful in forecasting what other components or workloads are being used in an environment. Dynatrace shows its value in this situation with topological auto-discovery capabilities, enabling consumers to all touch points in and out of applications. Dynatrace observes all transactions at service, process and host layers to ensure that nothing is missed with no manual configuration required. This same capability can be used to populate and maintain real-time CMDBs.
NB: Enabling the tooling to do the leg work so that you can analyse the environment once it begins populating the platform with data to help with that desired revelation of your applications activities.
Intelligent analysis and reporting
Stage 3: Group
With the distribution of agents or connection configuration into an environment after Stage 1 and Stage 2 are completed, Versent begins refining elements whilst bringing together components, integrations and workloads into a filtered view which can be measured and monitored as one service.
Adding attributed filters to these resources then provides desired dashboarding of how service(s) are operating.
It’s recommended to allow time for this process to be taken with all stakeholders and sponsors as their interests are not all identical, and it’s important to measure all areas of importance to all those who have interest in the operations of the application stack in question.
NB: Filtering what matters helps with identifying the information to business value. Graphs are only as valuable as the metrics you want to see.
Versent defines service groups for dashboards by adopting basic areas of separation such as environments (dev, test, prod), service type (prod ecommerce portal), and sometimes even technology quantity i.e., (prod Apache).
It’s also worth using discretion when using groups that are full of many different components and workloads as this introduces report pollution and becomes unsustainable and noisy.
Example: “all of AWS Production”
This may include multiple production applications not related to one another which may be inappropriate to report on.
The Dynatrace Software Intelligence Platform allows for this challenge to be easily rectified by enhancing visibility on the wider landscape with focus and granularity across the service filters which are infinitely customisable.
Run and improve always
Stage 4: Refine
After a series of configuration exercises for grouping and definitions for any reporting, Versent continues to support and recommend always refining custom views and Real User Monitoring (RUM) actions to help ongoing visibility.
This last step is ongoing and iterative as there are always things changing in applications. This phase is also the period to look for shoring up the boundaries of performance and service health levels that can be expressed as Service Level Objectives (SLOs) & Service Level Agreements (SLAs).
Therefore, it’s important to continue the observation and measurement of changes along with the application change (improvements) as it will continue to show how the logic and integrations of an application are operating and add business value.
NB: Keeping an eye on the environment to support how it’s operationally working but on-going management for configuration helps keep those things important to your organisation operating.
Versent considers these 4 stages to address onboarding and optimising for APM and observability, with Dynatrace.
So, now ask yourself, in the context of your organisation:
- Is it important to know how your application operates?
- Is it important to know why certain transactions operate with other services or databases?
- Is it crucial to set SLA’s and SLO’s for applications to communicate and commit data to one another?
If you said ‘Yes’ to any of the above, then using Dynatrace® with Versent’s Professional Services team is a path forward to lifting the observability fog and obtaining crystal clear visibility into your business-critical systems.
Please reach out and get in touch with a Versent expert to learn more.
Justyn Green
Principal Solutions Architect, Versent
justyn.green@versent.com.au