Streamline Log Analysis with Programmable Insights

Malinda Kapuruge
Lead Engineer
Malinda Kapuruge
Lead Engineer
Leveraging Grafana’s HTTP API for Programmatic Access
Introduction
Extracting meaningful data from application and infrastructure logs is crucial to ensure that the system operates as expected, providing visibility into its reliability, security, and performance aspects.
While there are Application Performance Monitoring (APM) tools, such as Grafana dashboards, to monitor and visualise those log metrics, sometimes it is necessary to feed them back into a functional system. For example, an actuator that tunes a system based on its current performance. Or an external system that ensures security compliance requirements are met, etc. In such cases, it may be necessary to access these log metrics programmatically, by another system or machine.
In this article, we describe how the Grafana HTTP API can be used along with Prometheus and Loki to extract and expose the log metrics based on applications and infrastructure logs so that another system can access them in a programmatic manner. We also provide a set of best practices and tips to avoid possible pitfalls in designing such a setup.
The Monitoring Trilogy: Introducing Grafana, Loki, and Prometheus
Grafana is an open-source platform for building dashboards and visualisations to monitor and analyse system performance metrics. It provides an interface for creating custom dashboards. Grafana can connect to multiple data sources, including Prometheus, Loki, and InfluxDB, among others.
Loki is a scalable, open-source logging system designed to collect, store, and query log data in a flexible and efficient manner. Loki’s architecture is built around the concept of “streams,” which represent individual log sources, such as servers or services. By integrating with Grafana, Loki can provide real-time log analytics and visualisations, helping teams identify issues and improve application performance.
Prometheus is a popular open-source monitoring system that utilizes a time-series database model to store metrics, enabling efficient querying and analysis of large datasets. By integrating with Grafana and Loki, Prometheus can provide comprehensive monitoring capabilities, including
real-time dashboards, log analytics, and alerts.
Programmatic access to log metrics
Assume the logs of a target system ( System A ) are required to be monitored and processed by the monitoring system ( System B ).

A naive approach would be to directly access the logs emitted and process them in System B to accomplish its business requirements. For example, to ensure a set of API endpoints doesn’t result in too many authentication failures. While this is simple and direct, it may not be the best solution due to two main reasons,
- System B may require frequent access to logs, demanding higher data transfer costs and processing power.
- System B may require deriving business context from a long history of logs, demanding to crawl a large volume of logs. Keeping a large volume of logs and querying them on demand can be an expensive operation.
In order to find a solution to the above challenges, we recommend the following design using Grafana, Loki, and Prometheus. We also describe a number of best practices to follow in such a design.
Recommended Design
In the following simplified diagram, we demonstrate how the overall system can be designed to overcome the aforementioned challenges.
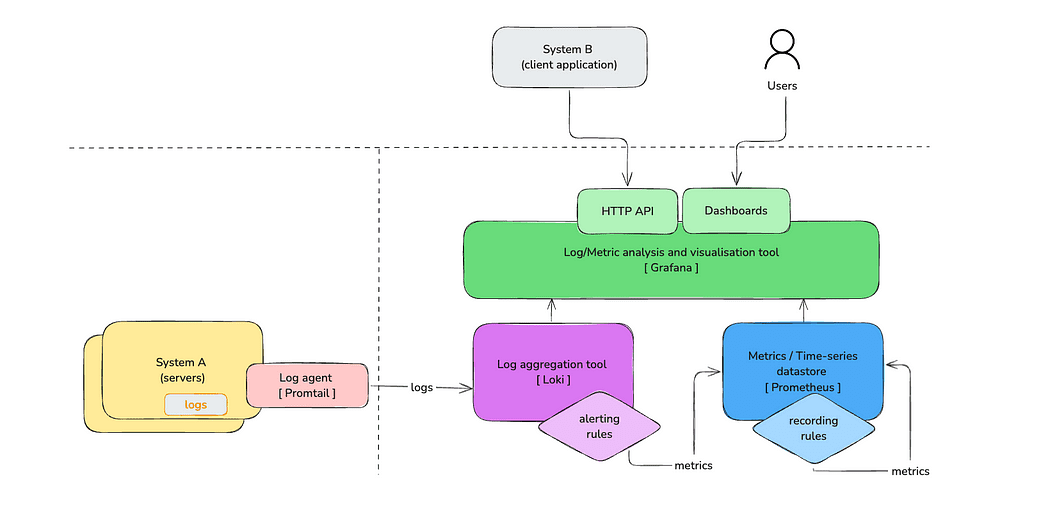
Let’s first familiarise ourselves with the components in the diagram.
The servers where the workloads run emit logs. This could be both the application and the infrastructure logs. Then, a log agent such as Promtail scrapes these logs and sends them to a log aggregation tool such as Loki. These logs could be inspected via a log visualisation tool, such as Grafana dashboards. Loki recording rules are used to emit metrics based on logs and record in a time-series datastore such as Prometheus. Then those metrics can be aggregated to produce other metrics using Prometheus’s recording rules. When programmatic access to these metrics is required, Grafana’s HTTP API can be used to access them, treating Prometheus as a data source.
Best Practices
In this section, we highlight a number of best practices to go with the above design.
Metric-First Approach
The overall system has been designed with two important design aspects in mind.
- Store metrics instead of logs: Metrics are lightweight compared to logs. Therefore, metrics are better suited for storing data for longer durations and being processed or aggregated.
- Scan to extract once, use many times: The logs are scanned only once, irrespective of how many times the data encapsulated in them needs to be read.
Metrics are more efficient to process compared to logs. A metric is a counter or a gauge that represents an observable aspect of a system, e.g., the number of errors that occurred within the last hour. They are numeric, allowing for aggregation or comparison later to answer a business query.
In addition, the logs already emitted aren’t going to change as they capture events that occurred in the past. Therefore, logs have to be scanned only once to extract the metrics. When a stream of textual logs is observed, a stream of metrics could be emitted and preserved, discarding the bulky log streams (perhaps keeping logs in a low-cost storage for regulatory requirements is necessary).
In this design, we use Loki’s LogQL and recording rule capabilities to extract the metrics and pump them into Prometheus to keep the metrics for further processing.
Differentiate Primary vs Business Level Metrics
In our design, we categorise metrics into two distinct categories to enhance reusability, maintainability, and efficiency in processing log metrics.
- Primary level metrics: Represent a basic event extracted from a single log entry. These primary-level metrics represent the smallest building blocks that may not have a direct business meaning but can be used later to construct business metrics.
- Business-level metrics: A business-level metric is constructed by using one or more primary metrics. They represent a quantifiable measurement that can be used to indicate performance of relevant to the business.
As an example, a metric that indicates a request being made to a specific endpoint, or an HTTP 401 response, is considered a primary metric. A set of Loki recording rules will be dedicated to emitting these metrics based on what’s been observed from the log stream in Loki. These emitted primary metrics will be stored in Prometheus.
Then, such metrics could be used to emit business-level metrics. A business-level metric is defined to answer a business-specific query. For example, how many API calls for a set of critical endpoints resulted in HTTP 401 errors is a business metric that could be emitted based on the aforementioned primary metrics. These business-level metrics are also stored in Prometheus and will be served via the HTTP API.
It should be noted that the business-level metrics can be derived from other business-level metrics, too, making a hierarchy of metric aggregations. In some cases, this helps improve the reusability of the codebase. However, due diligence is needed to avoid too complex hierarchies, as this may lead to an unmaintainable codebase.
As shown below, we query the business-level metric `my_biz_level_metric` recorded in Prometheus via the Grafana HTTP API, treating Prometheus as a datasource.
GET [GRAFANA_BASE_URL]/api/datasources/proxy/uid/prometheus/api/v1/query?query=my_biz_level_metric
Such a request will return a response as follows, which can be used by another monitoring system (System B above) to store in a database or perform its own computations over.
{
  "status": "success",
  "data": {
    "resultType": "vector",
    "result": [{
        "metric": {
          "__name__": "my_biz_level_metric"
        },
        "value": [  1743724800.781, "35" ]
    }]
  }
}
So, in a nutshell, the primary metrics are emitted from Loki’s recording rules. Then these primary metrics will be used by Prometheus recording rules to emit business-level metrics that can be queried via Grafana’s HTTP API.
Managing Recording Rules
Pre-calculating the business-level metrics via recording rules and keeping them in Prometheus to be served is a huge benefit when there are noisy clients. While the HTTP API allows accessing the metrics, it is important to properly define and maintain these recording rules in both Loki and Prometheus.
Recording rules are defined in YAML files. Where these YAML files should be located is primarily based on how the Grafana+Prometheus+Loki ecosystem is deployed. For example, if Helm charts are used in your deployment setup, please refer to the following documentation on installing and configuring Grafana Loki with Helm. Alternatively, you may consider using a cloud storage such as S3 to store these files.
The recording rule in Prometheus derives a business-level metric, auth_error_modifications, from a primary-level metric, api_call . In this example, it gets the total number of HTTP 401 errors on either POST or PUT api calls recorded within the last hour.
- record: auth_errors_modifications
  expr: sum(sum_over_time(api_call{ http_response_code="401" , http_method=~"POST|PUT"}[1h])) or vector(0)
The underlying primary level metric in Loki will emit the required labels, such as http_response_code and http_method . The same primary-level metric can be used to define another business-level metric by using another set of labels. Therefore, it is important to identify these dependencies when deciding the labels, especially for primary-level metrics.
In addition, these rules will be changed/deleted, or new rules will be added over time. Therefore, it is important to version control the rules. This will also help promote the rules from development to higher environments, such as production, in a consistent manner.
The Power of the Pattern Parser
Not every system is producing structured logs, e.g., JSON formatted, that are easy to parse by machines. It may require deriving metrics from semi-structured logs.
Since Loki 2.3, you can unleash the power of the pattern parser to process the semi-structured logs to extract metrics. The pattern parser improves the readability of recording rules and also eliminates the need to refactor the application code to emit structured logs.
In the following example, we show how several metrics are derived from an unstructured log line.
sum(count_over_time({namsespace="payments"} | pattern "<_>|<_>|<path> <http_method>|<http_response_code>" [1m]))
In the given example, we use the pattern parser to extract information from an API request. We extract path, http_method, and http_response_code from a log line. These are called the labels. The values /payments, GET and 400 will be assigned to each of these labels based on the following log.
2025–03–20T23:56:06,310|1aqD7CG4fPxfngwazc3omw | /payments GET | 400
There are a number of best practices that need to be followed when using a pattern parser efficiently.
- Avoid high-cardinality labels: A high-cardinality label is a label that has a very large number of distinct values. As you can see in the above example, we did not allocate a label for the timestamp and the UUID. We skipped them with an unnamed capture
<_>. Having a high-cardinality label can lead to performance issues in Prometheus. - Filter first, then parse: It is important to filter the logs prior to applying the pattern parser so that the parser queries are applied only over the required logs.
Bonus Tips
Here are some bonus tips that will help you to leverage Grafana’s HTTP API for programmatic access.
- Use the LogQL simulator to quickly simulate or test your LogQL expressions. You may run your expression against a set of sample logs. This is particularly useful to get a quick feedback on your expressions prior to trying out in the real logs. And it is also handy as a learning tool if you are new the language.
- Use the Grafana query builder to build your PromQL expressions. This will help identify the available labels and operations for your expressions dynamically based on the underlying metrics.
- Use Grot. Grafana Labs provides an AI helper to assist with your questions. It can be useful to find the required information faster.
- Use Service Account Tokens to access the Grafana HTTP API instead of user accounts. Service Account Tokens are designed to secure machine-to-machine interactions and automations. The permissions can be managed in a more granular manner, and the tokens can be rotated as needed without impacting the users.
Conclusion
Automating log metric extraction using Grafana’s HTTP API, combined with the strengths of Prometheus and Loki, offers a scalable and efficient approach to observability in modern software systems. By transforming bulky, hard-to-query logs into lightweight, meaningful metrics, teams can reduce system overhead, increase performance, and gain actionable insights in real time.
The architecture discussed in this article promotes a clean separation between the Primary and Business-level metrics, ensuring better maintainability and clarity in monitoring strategies. With thoughtful implementation of recording rules, strategic use of pattern parsing, and careful rule management, organisations can build a robust, programmatically accessible observability stack that empowers both developers and automated systems to respond intelligently to operational signals.